
Specifications


© 2006 Cisco Systems, Inc.
All rights reserved.
Scenarios 3-41
NAM / Traffic Analyzer v3.5 Tutorial
© 2006 Cisco Systems, Inc. All rights reserved.
Scenarios 3-41
NAM / Traffic Analyzer v3.5 Tutorial
Scenario 3
ART Server Data (VLAN 100)
Scenario 3
ART Server Data (VLAN 100)
Zoom in for
more details
Zoom in for
more details
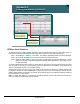
ART Server Data
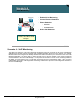
Dean is ready to view how the Cisco CallManager application is performing. Based on the placement of the
NAM in the distribution switch, the times reported will be from the distribution switch, to the server farm
workgroup access switch, to the Cisco CallManager, and back. It would be better to have the NAM in the
server farm workgroup access switch in order to get server think time, but Dean will have to wait until he
upgrades that switch to a Cisco Catalyst® 6500 Series. Remember that no data will be available for at least
30 minutes. To see the server response times, Dean does the following:
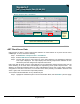
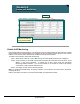
Step 1. Select Monitor > Response Time > Server. The Server Response Time screen is displayed.
Step 2. Select VLAN 100 from the Data Source pull-down list.
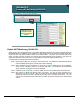
Dean sees the two Cisco CallManager application hosts listed and their response-time statistics. Using this
data, Dean can see that one of the Cisco CallManagers is responding better than the other. This could be
due to many factors, including configuration, but at least now Dean has data to use as a starting point. It is
important to note that the data displayed is for the last ART interval which, by default, is 30 minutes;
however, if a more granular resolution is needed, the interval can be lowered down to 30 seconds.
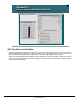
To see more details about the response time statistics for any listed server:
Step 3. Select the server you wish to view more details about.
Step 4. Click Details.