
Specifications


© 2006 Cisco Systems, Inc.
All rights reserved.
Scenarios 3-40
NAM / Traffic Analyzer v3.5 Tutorial
© 2006 Cisco Systems, Inc. All rights reserved.
Scenarios 3-40
NAM / Traffic Analyzer v3.5 Tutorial
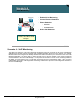
Scenario 3
Enable ART Monitoring (VLAN 100)
Scenario 3
Enable ART Monitoring (VLAN 100)
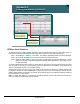
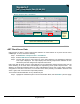
Setup > Monitor > Response Time Monitoring
Select data source to
enable ART on and
configure the report
interval and response
buckets
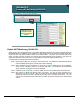
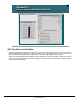
Select data source to
enable ART on and
configure the report
interval and response
buckets
Enable ART Monitoring (VLAN 100)
Again, like any other monitoring activity on the NAM, Application Response Time (ART) monitoring must first
be enabled before any statistics can be collected. You may recall from our discussions in Chapter 2 that ART
results can have very different values based on the NAM location. The closer you place the NAM to the
server you want to monitor, the more your response time values will reflect server think time. The closer you
position the NAM to the client, the more your response time values will reflect transaction time.
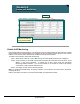
To enable ART monitoring, Dean does the following:
Step 1. Select Setup > Monitor > Response Time Monitoring. The Response Time Monitoring Setup
screen is displayed, listing any currently active ART monitoring.
Step 2. ART is enabled on a per-VLAN basis. If the VLAN you wish to enable ART for is not displayed,
select Create; otherwise, select the VLAN and click Edit. The Response Time Monitoring
Setup, Collection Configuration screen is displayed.
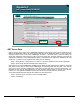
Step 3. Select the VLAN, VLAN 100, you wish to enable ART for from the Data Sources pull-down list.
Step 4. ART values by default are reported every 30 minutes. The time for each response pair is
attributed to one of six buckets. Also the number of pairs, maximum and minimum time, and
average are reported for each client/server pair seen on the monitored data source. You can
change any of the listed values; click Submit to enable the ART monitoring for the selected data
source.