
Specifications


© 2006 Cisco Systems, Inc.
All rights reserved.
Scenarios 3-16
NAM / Traffic Analyzer v3.5 Tutorial
© 2006 Cisco Systems, Inc. All rights reserved.
Scenarios 3-16
NAM / Traffic Analyzer v3.5 Tutorial
Scenario 1
Host View VLAN 130
Scenario 1
Host View VLAN 130
See next page
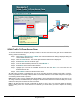
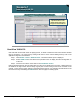
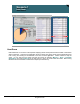
Zoom in on one of the
reported hosts to view
details about application
usage and conversations
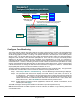
Zoom in on one of the
reported hosts to view
details about application
usage and conversations
Host View VLAN 130
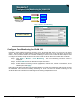
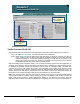
Now that Dean knows which hosts are playing Doom, he wants to determine what other network activities
they are involved in. He can do this by looking at all hosts in VLAN 130 and drilling down by host to see
application usage and conversations.
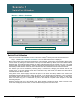
Step 1. Click Monitor > Hosts > Network Hosts. The Network Hosts report is displayed.
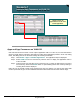
Step 3. Select VLAN 130 from the Data Source pull-down menu to display all hosts sending traffic on
VLAN 130.
Step 4. Choose a sort criteria. Dean clicks on the In Packets/s column.
Dean is presented with the users by packet rate on VLAN 130 on SPAN source port Gi1/2. Drilling down into
the details of the high-volume users is always a good place to start looking for the source of trouble on the
network. This is done by simply clicking on the desired host in the list, or by selecting the radio button to the
left of the host entry and clicking the Details button. See next page for resulting report.