
Specifications

© 2006 Cisco Systems, Inc.
All rights reserved.
Product Features 2-149
NAM / Traffic Analyzer v3.5 Tutorial
© 2006 Cisco Systems, Inc. All rights reserved.
Product Features 2-149
NAM / Traffic Analyzer v3.5 Tutorial
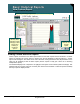
Basic Historical Reports
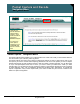
View Custom Report
Basic Historical Reports
View Custom Report
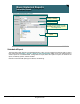
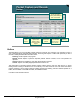
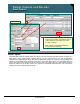
System events
that may affect
reporting include
changing of data
sources and
enabling of
monitoring
options
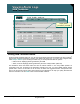
System events
that may affect
reporting include
changing of data
sources and
enabling of
monitoring
options
Launch by selecting a report from Reports > Custom Reports
Launch by selecting a report from Reports > Custom Reports
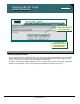
Display is the
same as used
for basic
reports
Display is the
same as used
for basic
reports
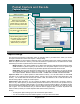
Viewing Custom Historical Reports
Custom reports are viewed in the same report window as the basic reports and are launched in a similar
manner by selecting the custom report for viewing from the list displayed by selecting Reports > Custom
Reports and clicking the View button. Since this is the same viewing window and GUI, all parameters of the
report can be modified just like the basic reports (Custom reports is really just a short cut for selecting
multiple basic reports).
One additional display item of importance to highlight is the system event indicator (small red triangle). This
indicates that some system event has occurred (new SPAN source selected or collection options modified)
that may impact the displayed data.