
Specifications


© 2006 Cisco Systems, Inc.
All rights reserved.
Product Features 2-138
NAM / Traffic Analyzer v3.5 Tutorial
© 2006 Cisco Systems, Inc. All rights reserved.
Product Features 2-138
NAM / Traffic Analyzer v3.5 Tutorial
Viewing Traffic Reports
Server Response Time Drill-Down
Viewing Traffic Reports
Server Response Time Drill-Down
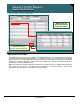
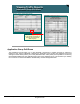
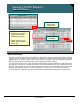
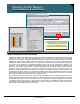
Detailed reports show the buckets
you created during configuration to
report on the individual response-
time samples (for all client requests).
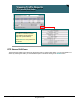
Detailed reports show the buckets
you created during configuration to
report on the individual response-
time samples (for all client requests).
Monitor > Response Time > Server
Server Response Time Drill-Down
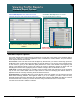
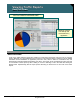
As discussed earlier in the Response Time configuration section, depending on placement, the NAM reports
statistics for either server “think” time (NAM placed close to the server) or request response-time (NAM
placed close to the client - subtracting these two numbers would give you network “flight” time). The reports
available for response time measurements fall into these two categories. If you want to view server-based
statistics (the amount of time it takes a server to respond to all client requests), then view Server reporting. If
you want to view statistics for individual client/server pairs, then choose Client/Server reporting. The
Response Time reports for both client/server and server begin with an overview that provides minimum,
maximum, and average response-times, as well as application protocol and the number of retries and late
responses. As with most other views, you can use a filter to refine your views to an individual server. By
default, the Traffic Analyzer shows you statistics for all server and client/server pairs, but you can also view
response-times by TopN. Finally, you can select an individual server using the radio buttons to the left of the
server name in either the Server or Client/Server menu and click the Details button to drill down to view more
detailed statistics about the individual server or client/server pair.
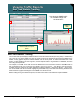
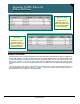
If you select the radio button next to the server and click the Details button, you will be presented with more
detailed information about the server performance for all client requests for a particular application. It includes
the information provided in the Overview table as well as a distribution of the time samples into the buckets
you defined during Setup > Monitor. It also gives you a bar graph of the distribution of time samples. This
information is useful for gaining more visibility in the minimum, average, and maximum values and a clearer
understanding of how well the server is performing.