
Specifications


© 2006 Cisco Systems, Inc.
All rights reserved.
Product Features 2-130
NAM / Traffic Analyzer v3.5 Tutorial
© 2006 Cisco Systems, Inc. All rights reserved.
Product Features 2-130
NAM / Traffic Analyzer v3.5 Tutorial
Viewing Traffic Reports
Real Time Statistic Tracking
Viewing Traffic Reports
Real Time Statistic Tracking
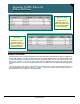
Monitor > Apps > Individual Apps
Select
statistic to
track
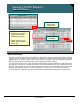
Select
statistic to
track
Select table entry to track, and
click the Real-Time report
option.
Select table entry to track, and
click the Real-Time report
option.
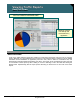
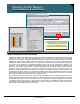
How does the SNMP traffic
on VLAN99 change over
the short term?
Real-Time Statistic Tracking
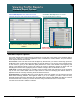
The Current Rate report displays statistical values for the last refresh interval (set using Setup > Preferences)
only. How can you view a statistic over time to monitor a trend? The Real-Time option button available at the
bottom of many graphs will plot a selected statistic over the short period. As will be discussed later in this
section, to track statistics over the long-term, use the Reports button to log the data to a database, and then
view using the Reports tab.
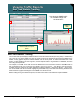
For example, on a NAM-1/2 we wish to track the SNMP rate to the second floor devices. All SNMP traffic in
this environment flows over VLAN 99. The SPAN is set up for port 2/1 – the uplink to the second floor.
VLAN99 was then configured to enable application statistics collection. Viewing the Monitor > Apps report,
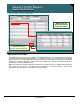
the current SNMP rate can be viewed. Highlighting the SNMP entry in the table and selecting the Real-Time
button launches a graph which begins to track SNMP over the short term.
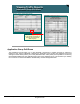
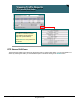
Before looking at long term historical reports, let’s first look at some of the drill-down reports available.