
Specifications


© 2006 Cisco Systems, Inc.
All rights reserved.
Product Features 2-129
NAM / Traffic Analyzer v3.5 Tutorial
© 2006 Cisco Systems, Inc. All rights reserved.
Product Features 2-129
NAM / Traffic Analyzer v3.5 Tutorial
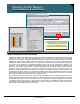
Viewing Traffic Reports
Standard Report Options
Viewing Traffic Reports
Standard Report Options
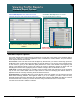
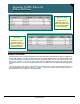
Cumulative Data Reports show all data
since the NAM started collecting.
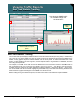
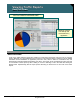
TopN Charts shows the TopN entries for the
selected statistic for the most recent refresh interval.
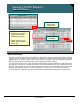
Current Rate Reports show data that has been
collected during the most recent refresh interval only.
These three reports are available for application,
hosts, conversations, VLANs, DiffServ, and port
statistics.
These three reports are available for application,
hosts, conversations, VLANs, DiffServ, and port
statistics.
Standard Report Options
The Traffic Analyzer offers three reporting perspectives: Current rates, TopN charts, and cumulative data for
almost every category of reporting: Application, hosts, conversations, VLANs, DiffServ, and port statistics.
These reports offer the follow details:
Current rates—This is the first screen that will appear by default when you choose a monitoring report from
the Monitor menu. Current rates screen provides you with the values for only the most recent refresh interval.
In other words, it gives you the difference (delta) between the value of the variable at the beginning and
ending of the sampling interval. Current rate values are useful for identifying changes in usage from one
sampling interval to the next, highlighting when a condition changes, either for the better or worse.
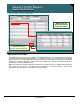
TopN Chart—This bar graph gives you a ranking of the top entries. Again, this chart gives you the top entries
only for the most recent refresh interval. TopN charts are useful for identifying the network devices or
applications that are currently consuming the most network resources.
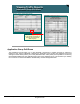
Cumulative Data—Cumulative data gives you the absolute value of the variable you are looking at since the
NAM started collecting statistics. This might be useful to you if, for example, you want to see how many
broadcast packets have been observed since the NAM started collecting data. Note: the NAM-1/2 counters
are cleared and reset to 0 when you execute the clear config command from the CLI of the switch.
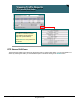
Let’s look at how to track a statistic in real-time.