
Specifications


© 2006 Cisco Systems, Inc.
All rights reserved.
Product Features 2-127
NAM / Traffic Analyzer v3.5 Tutorial
© 2006 Cisco Systems, Inc. All rights reserved.
Product Features 2-127
NAM / Traffic Analyzer v3.5 Tutorial
Viewing Traffic Reports
Selecting Data Sources
Viewing Traffic Reports
Selecting Data Sources
First select
Monitor
report type,
then select
data source
to view data
First select
Monitor
report type,
then select
data source
to view data
Real-time monitoring
reports found under
Monitor tab.
Real-time monitoring
reports found under
Monitor tab.
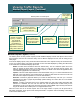
The Data Source
pull-down list
shows you only the
data sources that
have been enabled
for this collection
using the Setup >
Monitor task.
The Data Source
pull-down list
shows you only the
data sources that
have been enabled
for this collection
using the Setup >
Monitor task.
If the data source
that you want to
monitor is not on
this list, begin by
verifying that the
VLAN/NDE is part
of your configured
data sources and
that they have been
configured for this
type of collection
using the Setup >
Monitor task.
If the data source
that you want to
monitor is not on
this list, begin by
verifying that the
VLAN/NDE is part
of your configured
data sources and
that they have been
configured for this
type of collection
using the Setup >
Monitor task.
Selecting Data Sources
For most report generation dialogs, you will have at least two configuration options: your data source and whether
or not you want to auto-refresh the report. The concept of data sources was discussed in detail in the
Configuration section.
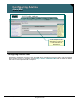
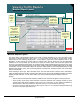
The important point to remember about viewing reports is that you will be only able to view Monitor reports for
data sources that you configured to be sent to the NAM and have enabled for data collection. For example, the
illustration shows ALLSPAN, DATAPORT1, DATAPORT2, VLAN1, VLAN32, VRF:customer_B, ERSPAN,
NetFlow, NDE-192.168.159.204, and Supervisor as pull-down options on a NAM-1/2. These data sources are
listed because they have been enabled for data collections from the Setup > Monitor task.
Note: The data sources listed here only mean that they have been enabled for data collection; it does not mean
that they are currently one of the data sources being sent to the NAM for analysis. Therefore, remember to “clean
up” the NAM configuration whenever the data sources are changed.
If you go to a report under the Monitor tab and the data source that you want to view reports on does not appear
on the pull-down list, that is because you did not configure it for this type of data collection. To do so, you must go
back to Setup > Monitor and configure the data source for this type of data collection. But before you do that, you
must ensure that the data source you want to monitor is actually being sent to the NAM. If this is confusing, review
the section on configuration again to complete these steps.
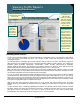
What do the data source pull-down options offer you? If you choose one of these data sources, the Traffic
Analyzer will show you statistics for that data source only, enabling you to drill down to a report for a single data
source.
You also have the option of enabling or disabling Auto Refresh. Auto Refresh tells the Traffic Analyzer to update
the tables, graphs, and charts with new data as it receives it. Enable Auto Refresh when you want to see fresh
data when it arrives, and disable it if you want to freeze a report view for any reason, perhaps while
troubleshooting. The refresh rate can be set using the Setup > Preferences task.