
Specifications


© 2006 Cisco Systems, Inc.
All rights reserved.
Product Features 2-126
NAM / Traffic Analyzer v3.5 Tutorial
© 2006 Cisco Systems, Inc. All rights reserved.
Product Features 2-126
NAM / Traffic Analyzer v3.5 Tutorial
Viewing Traffic Reports
Monitor Report Layout (Continued)
Viewing Traffic Reports
Monitor Report Layout (Continued)
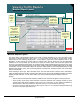
Bottom portion of monitor report
Rows to
display per
monitor report
page
Rows to
display per
monitor report
page
Use to display
more pages of
data.
Use to display
more pages of
data.
To use any of these
options, first select a entry
from the data table
To use any of these
options, first select a entry
from the data table
Capture launches a
data capture with a
filter for the selected
item from the monitor
report data table.
Capture launches a
data capture with a
filter for the selected
item from the monitor
report data table.
Real-time launches a
graph to track
selected item over
time.
Real-time launches a
graph to track
selected item over
time.
Report creates a
historical report and
starts collection of
data over time for
the selected item
from the monitor
report data table.
Report creates a
historical report and
starts collection of
data over time for
the selected item
from the monitor
report data table.
Details of selected item
depend on monitor
report. (i.e. details of
host shows all
applications and
conversations by
application for selected
host) Details is same as
clicking item in table row.
Details of selected item
depend on monitor
report. (i.e. details of
host shows all
applications and
conversations by
application for selected
host) Details is same as
clicking item in table row.
Monitor Report Layout (Continued)
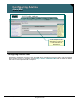
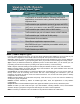
The bottom portion of many monitor reports provides additional display controls and options. Since screen
space is limited, the user can control how many rows of data are displayed at once, and can easily jump to
other pages.
As far as the display options, many will be discussed further later in the chapter but they are introduced here.
To use any of these options, first select the desired row from the table displayed by clicking the radio button
to the entries left. The additional display options are:
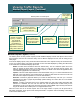
Details: Provides more information about the selected entry. This is a drill-down option and is the
same as clicking the main object in the table entry (i.e. host from the hosts monitor report). The
statistics displayed depend on the type of monitor report (i.e. details of host shows all applications and
conversations by application for selected host).
Capture: Launches a data capture based on the selected table entry. (i.e. if a host is selected from the
table with VLAN 100 selected, then a data capture is configured and started to look at the VLAN 100
data source and capture all packets to or from the selected host.)
Real-Time: Launches a graph that allows you to track the selected entry over time. (i.e. if a host is
selected from the table, a graph will periodically update showing the current value of a host statistic
selected by the user.)
Reports: Creates a historical report for the selected table entry and starts logging data about that
selection to a database. The user can at a later time use the Reports tab to view activity for the
selected item for up to 100 days from when the report was created. (Note: report will only have data as
long as the selected item remains part of a configured data source.)
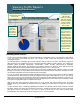
Next let’s look at how to run monitor reports. Due to the large number of reports, not all reports will be
discussed. Remember, many reports were already discussed in conjunction with the enabling of monitoring
on the various data sources.