
Specifications


© 2006 Cisco Systems, Inc.
All rights reserved.
Product Features 2-125
NAM / Traffic Analyzer v3.5 Tutorial
© 2006 Cisco Systems, Inc. All rights reserved.
Product Features 2-125
NAM / Traffic Analyzer v3.5 Tutorial
Viewing Traffic Reports
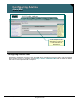
Monitor Report Layout
Viewing Traffic Reports
Monitor Report Layout
Choose your
viewing data
source here.
Choose your
viewing data
source here.
Most menus
have a filter
option to view
a subset of
data.
Most menus
have a filter
option to view
a subset of
data.
Use the radio
buttons to
select report
display view.
Use the radio
buttons to
select report
display view.
Some reports
have context-
sensitive
submenus if
they have more
viewing options.
Some reports
have context-
sensitive
submenus if
they have more
viewing options.
Select
monitor
report
type.
Select
monitor
report
type.
Continued
Print and data
export
options.
Print and data
export
options.
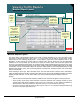
Monitor Report Layout
This figure offers a representative sample of the types of reports available to you. Once the main monitor
report type is selected (Overview, Apps, Voice,…), you can select how the data is reported. Most monitor
reports allow for the following display views: Current Rates, TopN Chart, and Cumulative Data. In this
illustration, we are viewing the current rates for network hosts. We are shown the host and associated
statistics for the host (Packets per second in/out, bytes per second in/out and non-unicast packets per
second). If we selected the TopN Chart, we would see a bar graph representing the top hosts for one of the
user selectable hosts statistics. Clicking on the column header of the Current Rates display will sort the table
by that value. If we chose Cumulative Data, we would see a table similar to the one illustrated above, but with
absolute total packets, bytes, and non-unicast packets received since the MIB counters were reset rather
than the current rates.
Once selecting a report type, select the data source from the Data Source Pull down menu. Remember,
earlier we talked about the pit falls of knowing what data sources are actually available and which have been
enabled for data collection. You can further refine your view by selecting a network address to filter on.
Note(s):
• Only the data sources that were enabled for Network Host collection will appear in the pull down list.
• Some monitor reports have context-sensitive sub-menus (left-hand side of display) if there are more
viewing options than those presented in the current view. In this case, you can obtain host statistics by
either network or MAC layer addresses. We have shown you a view of network hosts only.
• All monitor screens provide the option to either print or export (in .csv format) the displayed data using
the icons in the upper right-hand corner.