
Specifications


© 2006 Cisco Systems, Inc.
All rights reserved.
Product Features 2-123
NAM / Traffic Analyzer v3.5 Tutorial
© 2006 Cisco Systems, Inc. All rights reserved.
Product Features 2-123
NAM / Traffic Analyzer v3.5 Tutorial
Overview: Combination of several statistics, including most active
applications, most active hosts, protocol suites, and server
response times
Apps: Traffic statistics per application protocol (groups and URL)
Voice/Video: VoIP
(SCCP, H.323, MGCP, and SIP) and RTP stream monitoring
Hosts: Traffic statistics per network host or MAC station
Conversations: Traffic statistics per pair of network hosts or MAC stations
VLAN: Traffic statistics per VLAN and VLAN priority
DiffServ: Differentiated Service statistics
Response Time: Client-Server application response times
Switch: Mini-RMON and layer 2 statistics per enabled switch port
and overall switch health
MPLS: Traffic Statistics per MPLS tag
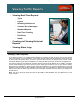
Viewing Traffic Reports
NAM-1, NAM-2 Report Types
Viewing Traffic Reports
NAM-1, NAM-2 Report Types
NAM-1, NAM-2 Report Types
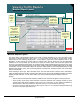
From the Traffic Analyzer main menu, you can view all the reports that are available to you as a result of your
data collection configuration choices made under the Setup tab. The reports for the NAM-1/2 include:
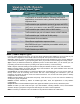
Overview—Offers an overview of performance that includes most active applications, hosts, protocol distribution,
and response-time statistics. A good reporting option when you just want to see how things are running overall.
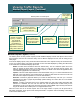
Apps—Gives you distribution statistics by application protocol. As discussed earlier, you can include your own
proprietary protocols in these reports by creating a new protocol in Setup > Protocol Directory.
Voice—Reports under this heading include packet loss and jitter statistics for SCCP, H.323, SIP, and MGCP.
Hosts—Provides statistics by network and MAC layer host information. This option identifies which users are
consuming valuable network and host resources.
Conversations—Provides statistics on network and MAC layer conversation pairs. You can use this option to
identify which hosts are accessing which servers and use it when analyzing how increases in your user
population may impact the load on server and network resources. You can also use these options to identify
configuration errors on devices.
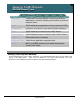
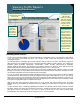
VLAN—Provides statistics by VLAN traffic and priority. From this menu, you can view resource utilization by
VLAN priority (CoS) configuration.
DiffServ—Provides statistics by DSCPs for DiffServ-type traffic, hosts, and applications to verify DiffServ
configurations.
Response Time—Provides detailed response-time graphs and tables by server and by client/server pairs.
Switch—Provides you with VLAN and layer 2 port level statistics, including utilization, errors, and broadcast
statistics—always a good place to begin when searching for the cause of network problems.
MPLS—Provides you with basic in and out statistics for any MPLS flow defined as a data source.