
Specifications


© 2006 Cisco Systems, Inc.
All rights reserved.
Product Features 2-122
NAM / Traffic Analyzer v3.5 Tutorial
© 2006 Cisco Systems, Inc. All rights reserved.
Product Features 2-122
NAM / Traffic Analyzer v3.5 Tutorial
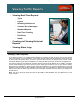
Viewing Traffic Reports
Viewing Traffic Reports
• Viewing Real-Time Reports
– Types
– Layout
– Selecting Data Source
– Common Error Messages
– Standard Reports
– Real-Time Trending
– Drill-Down
– Health
• Creating and Viewing Historical
Reports
• Viewing Alarm Logs
Viewing
Viewing
Traffic Reports
Traffic Reports
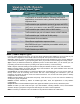
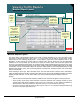
Viewing Traffic Reports
In the previous section, we configured data collection for reporting as well as alarms and we also viewed
some of the results of our configurations in the reports that the Traffic Analyzer generates. These reports can
be found under the Monitor tab. If you wish to view the data long term, a historical report can be created
causing the NAM to log the data to a database. The historical data can then be viewed from the Reports tab.
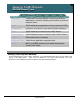
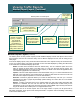
This section reviews in more detail the monitoring options found under the Monitor tab. In addition, it explores
how the Traffic Analyzer lays out the reports for you in a drill-down sequence, how you can view the data by
data source, the sub-tables on which monitor options are available to you, and what monitoring for voice and
application response times are also available. This section also covers the ability to create and view historical
reports and to view the alarm logs that store event messages generated from the alarms you configured in
the last section.
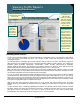
Note: The use of reports is exactly the same for the NAM-1/2 and NM-NAM. The only differences is in the
types of reports.