
Specifications

© 2006 Cisco Systems, Inc.
All rights reserved.
Product Features 2-103
NAM / Traffic Analyzer v3.5 Tutorial
© 2006 Cisco Systems, Inc. All rights reserved.
Product Features 2-103
NAM / Traffic Analyzer v3.5 Tutorial
Enabling Traffic Monitoring
Example: DiffServ Statistics
Enabling Traffic Monitoring
Example: DiffServ Statistics
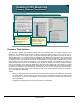
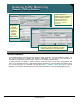
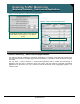
This table shows current data rates for
aggregation groups (as defined in the QoS
Search profile) seen on the data stream.
This table shows current data rates for
aggregation groups (as defined in the QoS
Search profile) seen on the data stream.
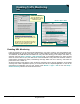
DiffServ application
statistics provide application
protocol statistics by data
source and profile you
created under Setup >
Monitoring > DiffServ
Monitoring.
DiffServ application
statistics provide application
protocol statistics by data
source and profile you
created under Setup >
Monitoring > DiffServ
Monitoring.
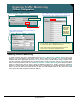
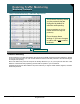
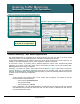
Drill down on
an application
to see all
conversations
for that
application
with the
selected
DSCP value.
Drill down on
an application
to see all
conversations
for that
application
with the
selected
DSCP value.
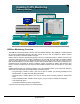
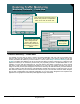
DiffServ Statistics
As illustrated, DiffServ monitoring provides reports on traffic, application, and host statistics by DSCP. You
can use this information to validate your DiffServ configuration. You can also use this information, in
combination with the response-time reports, to fine-tune your DiffServ implementation.
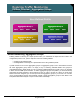
To further enhance your ability to monitor by DSCP values and ensure correct DSCP configurations, drill
down on an application listed for a selected aggregation and DSCP to view associated conversation pairs.
You can also drill down on a selected host from the Monitor > DiffServ > Host Stats menu to see all
application conversations the selected host is having with DSCP values in the selected aggregation group.