
Specifications

© 2006 Cisco Systems, Inc.
All rights reserved.
Product Features 2-99
NAM / Traffic Analyzer v3.5 Tutorial
© 2006 Cisco Systems, Inc. All rights reserved.
Product Features 2-99
NAM / Traffic Analyzer v3.5 Tutorial
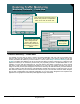
Detailed Response Time report for Selected
Server
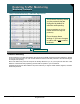
Response Time All Data Table
Enabling Traffic Monitoring
Example: Response Time Statistics
Enabling Traffic Monitoring
Example: Response Time Statistics
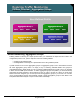
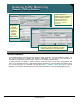
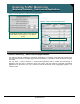
This chart shows detailed
server response-time statistics.
Select a server and click on the
Show Details button to view
detailed statistics for the
selected server.
This chart shows detailed
server response-time statistics.
Select a server and click on the
Show Details button to view
detailed statistics for the
selected server.
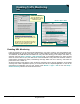
Notice the Response Time
Distribution section. The
distribution categories are a
result of the “buckets”
created during setup.
Notice the Response Time
Distribution section. The
distribution categories are a
result of the “buckets”
created during setup.
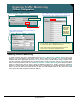
Monitor > Response Time
Response Time Statistics
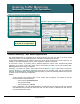
This illustration displays the monitoring reports that are generated when you enable Response Time
Monitoring. The uppermost image shows you the first screen that appears when you go to the Monitor >
Response Times > Server menu. This is a summary table that shows you statistics by server as seen by
selected data source. If you select a server by clicking the radio button next to the server name and click the
Show Details button, you will drill down into the detailed reports about the performance of your server based
on response times. If you recall the discussion on time buckets, you will see that the NAM shows you how
many samples fall into which time category. In the illustrated example, 560 individual occurrences of
response times were less than 25 milliseconds. Let’s say that we wanted to refine the collection because
most of the samples occur below 25 milliseconds. We could then reassign the time buckets to smaller
increments, say less than 10 milliseconds for the first bucket and 20 milliseconds for the second bucket, to
get even more visibility into the performance of the server. As you can see, refining these buckets enables
you to customize the data collection and reporting functions of the Traffic Analyzer software in the NAM to
meet your reporting requirements.
Note(s):
• When you enable response-time monitoring, the NAM collects and reports the statistics for the interval
you have defined, and the reports for the interval will not be displayed until the entire interval period
has ended. So, if you have just enabled it, do not expect to see reports until after the entire interval
period has passed.
• Changing the reporting interval can have performance considerations.