
Specifications

© 2006 Cisco Systems, Inc.
All rights reserved.
Product Features 2-98
NAM / Traffic Analyzer v3.5 Tutorial
© 2006 Cisco Systems, Inc. All rights reserved.
Product Features 2-98
NAM / Traffic Analyzer v3.5 Tutorial
Enabling Traffic Monitoring
Response Time
Enabling Traffic Monitoring
Response Time
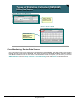
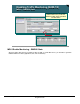
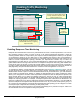
Setup > Monitor > Response Time Monitoring
Enable Response Time Monitoring for
available data streams by configuring
response buckets.
Enable Response Time Monitoring for
available data streams by configuring
response buckets.
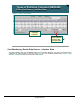
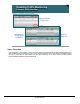
Select data
source and
configure
timing buckets
Select data
source and
configure
timing buckets
The first screen lists the data sources
currently enabled for Response Time
Monitoring data source.
The first screen lists the data sources
currently enabled for Response Time
Monitoring data source.
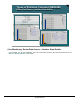
NAM-1/2
NAM-1/2
NM-NAM
NM-NAM
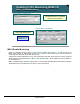
Enabling Response Time Monitoring
Response time measurements can be a very useful indicator of server or network performance. You can use
this monitoring function to warn you when a server or the network performance degrades. It works by
collecting statistics based on unique values (TCP sequence and acknowledgement numbers) in the packets
of conversations it observes in your data source. It then calculates the amount of time it took between a
request and the acknowledgement of the request. It is absolutely critical to identify the best location for the
NAM for accurate response-time reporting; otherwise your response-time numbers may not reflect the
response-times you think they do. Let’s review NAM placement for response time reporting: If you want to
gather statistics about how long it takes the server to complete a task (server think time), place a NAM close
to the server. Doing so will give you the most accurate reading on how long it took the server to respond. If
you want to gather information about both server think time and the time it takes the network to transmit the
data (flight time), then place another NAM close to a client that uses the application on the server.
To configure this feature, choose Response Time Monitoring from the Setup > Monitoring menu. You will
be given the option to choose which data source you want to monitor. Remember that on the NAM-1/2 if your
SPAN session consists of ports or a Cisco EtherChannel® tunnel as your SPAN source, you must determine
which VLANs your SPAN source belongs to. Editing the selected data source opens a dialog box which
allows you to configure the resolution of the response-time samples and how the samples are reported. The
report interval allows you to define the sampling interval, the amount of time to collect response-time
samples. The next seven options are buckets that the NAM uses to store the results of the response-time
samples for reporting purposes. For example, if a sample response-time measurement is determined to be
less than 5 milliseconds (ms), then the NAM would increment the RSPTime1 bucket by 1 and the NAM will
report that sample as one response-time sample of less than 5 ms. As you can see, these options give you a
lot of control over the granularity of response-time measurements and reporting you can configure. Let’s look
at a sample report of response time monitoring to clarify these points.
Note: Response time monitoring needs to see request-acknowledge pair to perform its analysis. Make sure
the selected data sources are capable of seeing both packets.