
Specifications


© 2006 Cisco Systems, Inc.
All rights reserved.
Product Features 2-79
NAM / Traffic Analyzer v3.5 Tutorial
© 2006 Cisco Systems, Inc. All rights reserved.
Product Features 2-79
NAM / Traffic Analyzer v3.5 Tutorial
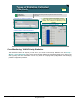
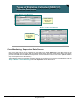
Basic NM-NAM Configuration
Step 2: Enabling Core Monitoring
Basic NM-NAM Configuration
Step 2: Enabling Core Monitoring
NM-NAM Internal
NM-NAM Internal
Local Router
Interfaces (Se0/0, Se0/1)
NDE Device
192.168.79.110
NM-NAM
Traffic Analysis
Engine
NM-NAM
Traffic Analysis
Engine
NDE Default
192.168.79.110
NDE Custom
“To WAN”
Internal
External
App
App, host, conv, voice,
ART, DiffServ, URL
App, host, conv, voice,
ART, DiffServ, URL
App, host, conv
NM-NAM External
(Configured as
Management Interface)
NM-NAM External
(Configured as
Management Interface)
Fast-Ethernet
Source
Router
Interface and
NBAR stats
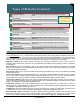
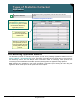
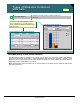
Step 2: Enable monitoring type
by data source
Step 2: Enable monitoring type
by data source
Step 1: Configure Data
Sources
Step 1: Configure Data
Sources
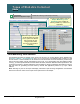
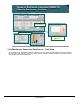
Enabling Data Collection (NM-NAM)
The NM-NAM differs from the NAM-1/2 in that NetFlow traffic is received on the NM-NAM interface
configured as the management interface and there is no subset data streams other than the NDE traffic. So in
the above example, traffic from interfaces Se0/0 and Se0/1 are being copied to the internal interface and the
external interface is connected to a Fast Ethernet segment. The resulting data streams that must be enabled
for analysis are Internal which is the aggregate of traffic on Se0/0 and Se0/1, External which is all traffic seen
on the connected segment, NDE Default which is all NetFlow traffic from device 192.168.79.110, NDE
Custom “To WAN” which is a subset of NDE traffic from 192.168.79.110, and Router which includes NBAR
and MIB-II interface statistics.
Now let’s look at how to enable some of these data streams for analysis.