
Specifications


© 2006 Cisco Systems, Inc.
All rights reserved.
Introduction 1-12
NAM / Traffic Analyzer v3.5 Tutorial
© 2006 Cisco Systems, Inc. All rights reserved.
Introduction 1-12
NAM / Traffic Analyzer v3.5 Tutorial
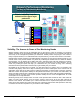
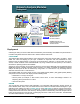
Network Performance Monitoring
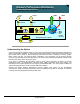
Different Monitoring Points for Application Usage
Network Performance Monitoring
Different Monitoring Points for Application Usage
Real-Time Traffic
Utilization
(Utilization, Errors, Talkers,
Conversations, Protocols)
Historical
Reporting
(Statistics over time)
Fault Isolation &
Troubleshooting
(Thresholds, Alarms,
Packet Decode)
Performance
Monitoring
(Response Times, Switch/Router
Health, Voice, Video, URL, QoS)
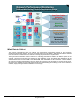
What Data to Collect
The network management plan may identify the performance requirements based on the previously
mentioned performance metrics. But how can these metrics be calculated? What data should be collected
from the network to determine if the network is meeting the performance requirements?
The figure above illustrates various reasons for collecting performance statistics at different points in the
network. Directly at the access port, statistics on port utilization, errors, and packet size distribution can be
obtained either from the Cisco MIB or the RMON MIB, both embedded on Cisco switches. These statistics
are useful for trending and baselining the port usage and it would not be necessary to monitor all user ports.
But when more visibility into the traffic upper layers and understanding who’s talking to who in the network is
needed, simply looking at interface statistics is not enough.