
Specifications


© 2006 Cisco Systems, Inc.
All rights reserved.
Product Features 2-76
NAM / Traffic Analyzer v3.5 Tutorial
© 2006 Cisco Systems, Inc. All rights reserved.
Product Features 2-76
NAM / Traffic Analyzer v3.5 Tutorial
Enabling Core Monitoring (NAM-1/2)
Example
Enabling Core Monitoring (NAM-1/2)
Example
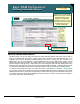
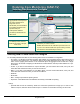
Step1: Create a SPAN session that uses the ports 1/1 and 1/2 as your SPAN
source and view your configuration settings via the Active Sessions Menu.
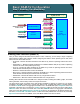
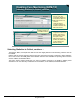
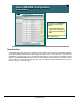
Step 3: View Network Host Statistics Report
by choosing the VLAN you configured in Step 2.
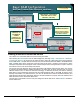
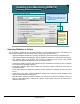
Step 2: Configure monitoring using the VLAN that your SPAN source (ports 1/1 and 1/2) are a member of (VLAN 904) as
your data source. Then choose Host Statistics to enable monitoring of host traffic.
Ports 1/1 and 1/2 are members of VLAN 904.
Ports 1/1 and 1/2 are members of VLAN 904.
Lists all hosts in VLAN
904 on ports 1/1 and 1/2
Lists all hosts in VLAN
904 on ports 1/1 and 1/2
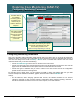
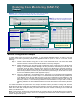
Monitor Configuration Example
To clarify these points, let’s look at an example. In the example illustrated above, we want to use port
spanning to see who is generating network and application traffic on ports 1/1 and 1/2. To do this, do the
following:
Step 1: Create a SPAN session using ports 1/1 and 1/2 as the SPAN source. Use the Active SPAN
Sessions window to ensure that the SPAN session is correctly configured.
Step 2: Gather information from the switch itself to determine which VLANs the source SPAN ports
belong to. (CiscoWorks Campus Manager can also provide this information) In this case, it is
VLAN 904. From the Setup > Monitor menu, choose Core Monitoring to configure monitoring.
From the menu Data Source pull-down list, notice that all the VLANs that the switch knows
about will be presented. Choose only the VLAN that the ports belong to, VLAN 904. From here,
choose Host Statistics (Network and Application layers).
Step 3: Then go to the Monitor > Host Statistics menu. This brings you to the Network and Application
Layer Host report that you chose in Step 2. You should see from the Data Source pull-down list
in the Monitor menu only the data sources this you have configured for Host Statistics, in this
case VLAN 904. If more data source options appear than you have configured, then return to
the Setup > Monitor > Core Monitoring submenu to review whether or not you want to continue
collecting statistics for those additional data sources that were listed in the Monitor pull-down
list.
You should remember two points here. First, always remember where your data is coming from: both the
SPAN Source and the VLANs that your SPAN source belongs to. Second, remember to set up monitoring to
match the VLANs that correspond with your SPAN source and then confine monitoring to the VLANs that
match your SPAN source.
Note: In this instance, because the ports both belong to a single VLAN, the ALLSPAN data source could also
have been used. Now you are ready to move on to configuring the NAM and the Traffic Analyzer software to
monitor and generate reports.