
User guide


Managing performance Chapter 7: Operation
7-64
phn-2513_004v000 (Oct 2012)
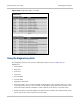
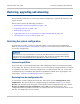
To plot diagnostics, proceed as follows:
1
Select menu option System, Diagnostics, Diagnostics Plotter. The Diagnostics
Plotter page is displayed (Figure 197).
2
Use the Diagnostics Selector drop-down list to select a diagnostic type to plot.
3
Use the Trace Selection to select traces of the maximum, mean or minimum
values of the diagnostic type. Maximum values are displayed in red, mean
values are displayed in purple and minimum values are displayed in blue.
4
Select Plot Selected Diagnostic. The trace is displayed in the graph.
Figure 197 Diagnostics Plotter page
Downloading diagnostic data
Perform this task to download snapshots of the system diagnostics to a CSV file.
The CSV file contains at most 5784 entries, recorded over a 32 day period:
• 3600 entries recorded in the last hour.
• 1440 entries recorded in the previous 24 hours.
• 744 entries recorded in the previous 31 days.