
User guide


PTP 800 Series User Guide Testing the ODU and IF cable
phn-2513_004v000 (Oct 2012)
5-63
Cable loss example using a 17 meter cable
This example is for a cable run consisting of the following:
• 0.7m cable from the test equipment to the first LPU.
• The first LPU.
• 17m of cable between the two LPUs (length ‘y’ in Figure 81).
• The second (mast mounted) LPU.
• 0.7m of cable from the LPU to ODU.
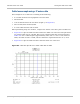
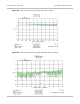
When performing steps 4 to 6 above, compare the ‘before’ and ‘after’ plots of cable loss:
• Figure 82 is a plot of cable loss taken before the ODU was connected. The plot shows
an average cable loss of 1.96 dB. This can be compared with the expected result in
Table 215. For a cable length of approximately 19m (17m + 0.7m + 0.7m) with two
LPUs, the table result is 1.9 dB, which is within the expected tolerance of +/- 10%.
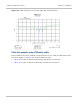
• Figure 83 is a plot of cable loss taken after the ODU was connected.
Figure 82 Cable loss plot for a 17 meter cable with no ODU