
User guide

2-24
Cisco WLAN Controller Web Interface User Guide
OL-7416-04
Chapter 2 Monitor Menu Bar Selection
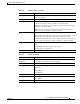
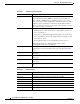
Radio > Statistics
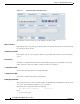
Figure 2-1 Profile Information in Graphics View
The following sections describe each of the Graphical and Text results.
Noise vs. Channel
Each channel of the access point appears along with the corresponding non-802.11 noise interfering with
the currently-assigned channel.
Interference by Channel
Each channel of the access point appears with the corresponding traffic interference from other 802.11
sources.
Load Statistics
Total Receive and Transmit bandwidth and channel utilization appears for transmitting and receiving
traffic on this Cisco radio. The number of attached clients is also displayed.
% Client Count vs. RSSI
Sorts attached clients by their Received Signal Strengths.
% Client Count vs. SNR
Sorts attached clients by their Signal to Noise Ratios.
Rx Neighbors Information
This area displays the Cisco radio’s neighboring APs, and their IP address and RSSI values. These details
are used for channel allotment and RF coverage area shaping.
This information is displayed similar to the following:
AP 00:0b:85:00:83:00 Interface 0 172.16.16.10
where:
• AP is an access point.