
User Guide


Quality Management Desktop User Guide
44 September 2009
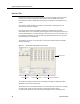
Group’s Team Average Scores Report
This report displays a summary of the evaluation points and average scores for each
team within the group over a specified time period, and the group’s average
evaluation score and total evaluations.
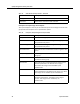
Total Below The total number of evaluated contacts whose scores
fall below expectations. The default score range is
0–74%. This range can be modified by the
administrator.
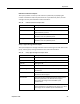
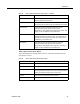
Table 17. Group’s Team Average Scores Report Fields
Field Description
Team The name of the team.
Team ID The team ID.
Total Evaluations The total number of evaluations performed on the
team’s agents.
Team Average (%) The average evaluation score of all the team’s
evaluations.
Score Std Dev The score standard deviation, calculated from all
evaluations for the team.
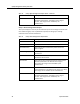
Total Exceed The total number of evaluated contacts whose scores
exceed expectations. The default score range is
90–100%. This range can be modified by the
administrator.
Total Meet The total number of evaluated contacts whose scores
meet expectations. The default score range is 75–89%.
This range can be modified by the administrator.
Total Below The total number of evaluated contacts whose scores
fall below expectations. The default score range is
0–74%. This range can be modified by the
administrator.
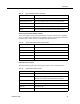
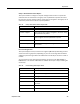
Table 16. Group’s Agent Average Scores Report Fields — Continued
Field Description