
User Guide


Quality Management Desktop User Guide
28 September 2009
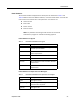
Score Std Dev The standard deviation of the agent’s
score. A low standard deviation (closer to
0) indicates that scores are grouped
closely to the mean score. A higher
standard deviation (further from 0)
indicates that scores are far from the
mean. A lower standard deviation is an
indicator of consistent performance; a
higher standard deviation is an indicator of
variable performance.
Team The team name.
Team Average The average score the team has earned in
the selected time period.
Team ID The team’s ID.
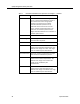
Total Below The total number of evaluated contacts
whose scores fall below expectations. The
default score range is 0–74%. This range
can be modified by the administrator.
Total Evaluations The total number of evaluations the agent
has had in the selected time period.
Total Exceed The total number of evaluated contacts
whose scores exceed expectations. The
default score range is 90–100%. This
range can be modified by the
administrator.
Total Meet The total number of evaluated contacts
whose scores meet expectations. The
default score range is 75–89%. This range
can be modified by the administrator.
Table 5. Dashboard Detail Statistics for supervisors and managers — Continued
Statistic Description