
User Guide


Dashboard Tab
September 2009 25
Dashboard Tab
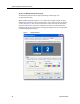
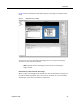
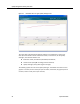
The dashboard tab (Figure 11 and Figure 12) provides a summary and detail display
of the contact center’s performance statistics for the last twelve months. The
summary displays are in the form of bar charts and graphs.
There is a standard set of statistics displayed in the dashboard, but the level at which
the statistics are presented depends on your role as agent, knowledge worker,
supervisor, or manager.
Figure 11. Dashboard tab for a supervisor, Quality Averages chart