
User Guide
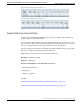
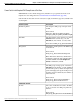
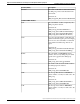

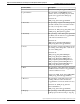
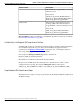
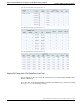
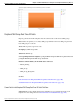
Table Of Contents
- Cover Page
- Table of Contents
- List of Figures
- Figure 1 : Agent Historical All Fields Report 1 of 3
- Figure 2 : Agent Historical All Fields Report 2 of 3
- Figure 3 : Agent Historical All Fields Report 3 of 3
- Figure 4 : Agent Not Ready Detail Report
- Figure 5 : Agent Real Time Report
- Figure 6 : Agent Skill Group Historical All Fields Report 1 of 3
- Figure 7 : Agent Skill Group Historical All Fields Report 2 of 3
- Figure 8 : Agent Skill Group Historical All Fields Report 3 of 3
- Figure 9 : Agent Skill Group Real Time Report 1 of 2
- Figure 10 : Agent Skill Group Real Time Report 2 of 2
- Figure 11 : Agent Team Historical All Fields Report 1 of 3
- Figure 12 : Agent Team Historical All Fields Report 2 of 3
- Figure 13 : Agent Team Historical All Fields Report 3 of 3
- Figure 14 : Agent Team Real Time Report
- Figure 15 : Agent Team State Counts Report 1 of 2
- Figure 16 : Agent Team State Counts Report 2 of 2
- Figure 17 : Call Type Abandon Answer Distribution Historical Report 1 of 2
- Figure 18 : Call Type Abandon Answer Distribution Historical Report 2 of 2
- Figure 19 : Call Type Historical All Fields Report 1 of 2
- Figure 20 : Call Type Historical All Fields Report 2 of 2
- Figure 21 : Call Type Real Time Report
- Figure 22 : Call Type Real Time Queue Now Pie Chart
- Figure 23 : Call Type Skill Group Historical All Fields Report
- Figure 24 : Agent Historical All Fields Report 1 of 3
- Figure 25 : Agent Historical All Fields Report 2 of 3
- Figure 26 : Agent Historical All Fields Report 3 of 3
- Figure 27 : Agent Not Ready Detail Report
- Figure 28 : Agent Real Time Report
- Figure 29 : Agent Skill Group Historical All Fields Report 1 of 3
- Figure 30 : Agent Skill Group Historical All Fields Report 2 of 3
- Figure 31 : Agent Skill Group Historical All Fields Report 3 of 3
- Figure 32 : Agent Skill Group Real Time Report 1 of 2
- Figure 33 : Agent Skill Group Real Time Report 2 of 2
- Figure 34 : Agent Team Historical All Fields Report 1 of 3
- Figure 35 : Agent Team Historical All Fields Report 2 of 3
- Figure 36 : Agent Team Historical All Fields Report 3 of 3
- Figure 37 : Agent Team Real Time Report
- Figure 38 : Agent Team State Counts Report 1 of 2
- Figure 39 : Agent Team State Counts Report 2 of 2
- Figure 40 : Call Type Abandon Answer Distribution Historical Report 1 of 2
- Figure 41 : Call Type Abandon Answer Distribution Historical Report 2 of 2
- Figure 42 : Call Type Historical All Fields Report 1 of 2
- Figure 43 : Call Type Historical All Fields Report 2 of 2
- Figure 44 : Call Type Real Time Report
- Figure 45 : Call Type Real Time Queue Now Pie Chart
- Figure 46 : Enterprise Service Historical All Fields Report 1 of 2
- Figure 47 : Enterprise Service Historical All Fields Report 2 of 2
- Figure 48 : Peripheral Service Historical All Fields Report 1 of 2
- Figure 49 : Peripheral Service Historical All Fields Report 2 of 2
- Figure 50 : Peripheral Service Real Time All Fields Report 1 of 2
- Figure 51 : Peripheral Service Real Time All Fields Report 2 of 2
- Figure 52 : Enterprise Service Historical All Fields Report 1 of 2
- Figure 53 : Enterprise Service Historical All Fields Report 2 of 2
- Figure 54 : Peripheral Service Historical All Fields Report 1 of 2
- Figure 55 : Peripheral Service Historical All Fields Report 2 of 2
- Figure 56 : Peripheral Service Real Time All Fields Report 1 of 2
- Figure 57 : Peripheral Service Real Time All Fields Report 2 of 2
- Figure 58 : Enterprise Historical Skill Group All Fields Report 1 of 3
- Figure 59 : Enterprise Historical Skill Group All Fields Report 2 of 3
- Figure 60 : Enterprise Historical Skill Group All Fields Report 3 of 3
- Figure 61 : Enterprise Skill Group Real Time Report 1 of 2
- Figure 62 : Enterprise Skill Group Real Time Report 2 of 2
- Figure 63 : Peripheral Skill Group Historical Report 1 of 3
- Figure 64 : Peripheral Skill Group Historical Report 2 of 3
- Figure 65 : Peripheral Skill Group Historical Report 3 of 3
- Figure 66 : Peripheral Skill Group Historical Skill Group Service Level Chart
- Figure 67 : Peripheral Skill Group Real Time Report 1 of 2
- Figure 68 : Peripheral Skill Group Real Time Report 2 of 2
- Figure 69 : Enterprise Skill Group Historical All Fields 1 of 3
- Figure 70 : Enterprise Skill Group Historical All Fields 2 of 3
- Figure 71 : Enterprise Skill Group Historical All Fields 1 of 3
- Figure 72 : Enterprise Skill Group Real Time Report 1 of 2
- Figure 73 : Enterprise Skill Group Real Time Report 2 of 2
- Figure 74 : Peripheral Skill Group Historical Report 1 of 3
- Figure 75 : Peripheral Skill Group Historical Report 2 of 3
- Figure 76 : Peripheral Skill Group Historical Report 3 of 3
- Figure 77 : Peripheral Skill Group Historical Skill Group Service Level Chart
- Figure 78 : Peripheral Skill Group Real Time Report 1 of 2
- Figure 79 : Peripheral Skill Group Real Time Report 2 of 2
- Figure 80 : IVR Ports Performance Report
- Figure 81 : Stock Templates
- Figure 82 : Importing Reports
- Preface
- Chapter 1: Cisco Unified Intelligence Center Report Templates
- Chapter 2: Unified CCE Release 8.x Agent and Agent Skill Group Reports
- Chapter 3: Unified CCE Release 8.x Call Type and Call Type Skill Group Reports
- Chapter 4: Unified CCE Release 7.5 Agent and Agent Skill Group Reports
- Chapter 5: Unified CCE Release 7.5 Call Type and Call Type Skill Group Reports
- Chapter 6: Unified CCE Release 8.x Enterprise and Peripheral Service Reports
- Chapter 7: Unified CCE Release 7.5 Enterprise and Peripheral Service Reports
- Chapter 8: Unified CCE Release 8.x Enterprise and Peripheral Skill Group Reports
- Chapter 9: Unified CCE Release 7.5 Skill Group Reports
- Chapter 10: IVR Reports
- Chapter 11: Working with the Reporting Templates
- Chapter 12: Unified ICM/CCE Reporting Concepts
- Abandoned Calls
- Agent States
- Average Speed of Answer (ASA)
- Bucket Intervals
- Call Detail Data
- Call Types
- Call Type Intervals
- Error Count
- FTE
- Handle Time
- Handled
- Historical and Interval Data
- Grouped Grids
- Media Routing Domain
- Overflow Out
- Percent Utilization
- Real Time Data and Real-Time Reports
- Redirection on No Answer (RONA)
- Report Fields
- Report Summaries
- Service Levels
- Services
- Short Calls
- Skill Groups
- Index
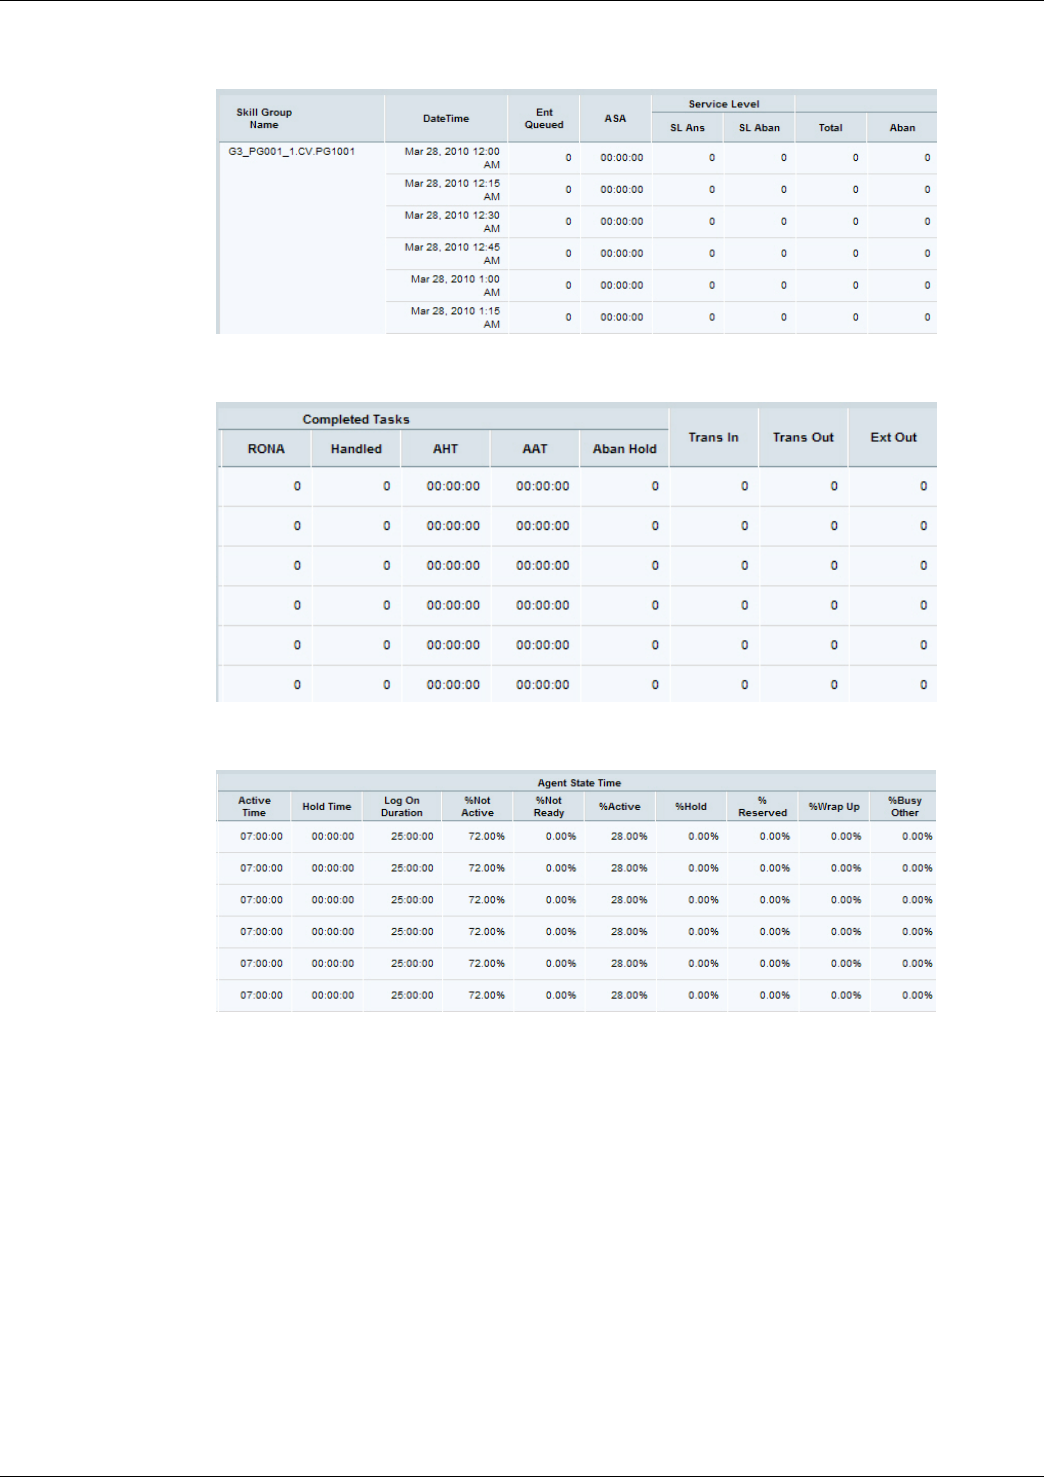
Figure 63: Peripheral Skill Group Historical Report 1 of 3
Figure 64: Peripheral Skill Group Historical Report 2 of 3
Figure 65: Peripheral Skill Group Historical Report 3 of 3
Peripheral Skill Group Historical Skill Group Service Level Chart
The stock graph for this report is a stocked bar chart that shows Aban, RONA, Handled, Aban
Hold by Skill Group.
To see this chart, run the Peripheral Skill Group Historical All Fields report and then select Skill
Group Service Level from the Report Viewer.
Report Template Reference Guide For Cisco Unified Intelligence Center Release 8.0(4)
159
Chapter 8: Unified CCE Release 8.x Enterprise and Peripheral Skill Group Reports
Peripheral Skill Group Historical All Fields