
Release Notes


New features introduced in 4.0(1.57)
Cisco TelePresence Server Software Release Notes (4.0(2.8)) Page 13 of 36
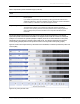
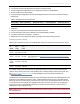
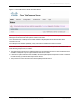
How to read the chart:
The shading levels on the chart represent the fractions/multiples of screen licenses that the TelePresence
Server reports to the managing system for the given bandwidth ranges and content quality limits. The key
relates types of calls to each of those levels.
There are two horizontal bars for each profile; the upper bar shows the reported licenses when the conference
content quality is set to 1080p30 on the Conductor; the lower bar shows the reported licenses when the
Conductor limits the conference content quality to 720p5. The Conductor has two intermediate content
quality levels that are not shown.