
User Guide

Chapter 8 Main View
Alarm Bars View
8-16
Cisco AlarmTracker Client User Guide
OL-1501-01
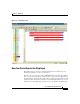
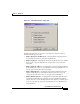
earliest Creation Time of the all the Alarms being displayed. The maximum time
is slightly greater than the current time. The horizontal scroll bar allows you to
move across this time span.
Each Alarm bar represents a single Alarm object. The left edge of the bar indicates
the time that the Event that signaled the Alarm was received by the LGMapper.
All other Events that mark State transitions are shown as different colored
sections in the bar. Each time marked is the time that the Event was received by
the LGMapper Server.
Multiple Alarms for the same Listener object are shown on the same row. Thus,
in this view you can see patterns of a device continuously "bouncing" if you see
many Alarm bars on the same row.
You may also be able to visually correlate Alarms for different devices as you look
up and down in the display.
The following colors and patterns are used to indicate Alarm State and
Assignment Status:
• Solid red - indicates a Down State that is unassigned,
• Solid blue - indicates an Application Error that is unassigned,
• Diagonal hatched pattern of red and brown - indicates a Down State that
is assigned,
• Diagonal hatched pattern of green and brown - indicates an Up State that
is assigned,
• Diagonal hatched pattern of red and cyan - indicates a Down State that is
Excluded,
• Diagonal hatched pattern of green and cyan - indicates an Up State that is
Excluded.
• Diagonal hatched pattern of blue and brown - indicates an Application
Error that is assigned,
In addition, Alarms that are shown with a right-pointing arrow indicate Alarm
objects that are still open.
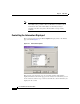
All Alarm objects are shown with the System Name associated with the Alarm
drawn below each Alarm Bar. When the View has focus, a ToolTip will also pop
up when you hover over an Alarm bar. The ToolTip contains information about
the particular Alarm segment you are hovering over. This ToolTip contains the
following information: