
User Guide
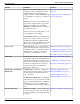
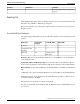
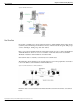
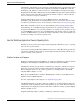
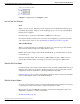
Table Of Contents
- Cover Page
- Table of Contents
- List of Figures
- Figure 1 : Central Controller
- Figure 2 : Peripheral and Peripheral Gateway
- Figure 3 : Administrative Workstation
- Figure 4 : WebView Server
- Figure 5 : Diagram of System Components
- Figure 6 : ICM Data Environment
- Figure 7 : Real-Time Data Moves to AW Local Database
- Figure 8 : Icons for Graphs and Tables
- Figure 9 : Deployment with Enterprise Routing
- Figure 10 : Sample Script for Enterprise Routing
- Figure 11 : Script Example for Agent Level Routing
- Figure 12 : Sample Script for Hybrid Routing
- Figure 13 : Agent State and Task State Relationship
- Figure 14 : Sample Routing Script for Information Gathering and Queuing
- Figure 15 : Call Type Data for Calls that Abandon after Call Type is Changed
- Figure 16 : Call Type Data for Calls that Abandon before Call Type is Changed
- Figure 17 : MultiChannel Options
- Figure 18 : Agent State Hierarchy
- Figure 19 : Call Abandoned While On Hold Scenario
- Preface
- Chapter 1: System Architecture and Reporting
- Chapter 2: Understanding Reporting
- Chapter 3: Understanding Routing and Queuing
- Chapter 4: Planning for Reporting
- Planning for Reporting at Unified ICM Setup
- Planning for Your Deployment
- Planning for Configuration and Scripting
- Planning for Agent Reporting
- Planning for Call Types
- Planning for Custom Reporting
- Planning for the HDS
- Planning for Enterprise Routing and Enterprise Reporting
- Planning for Service and Enterprise Service Reporting
- Planning for Service Level
- Planning for Short Calls
- Planning for Skill Groups and Enterprise Skill Groups
- Planning for Transfer and Conference Reporting
- Planning for Translation Routing
- Planning for Unexpected Scripting Conditions
- Planning for VRU Application Reporting
- Chapter 5: Reporting on Agents
- What Agent Data do you Want to See?
- Reporting on Agent Activity in Skill Groups
- Reporting on Agent States
- Reporting on Average Speed of Answer for Agents and Skill Groups
- Reporting on Agent Logout Reason Codes
- Reporting on Agent Not Ready Reason Codes
- Reporting on Agent Task Handling
- Reporting on Agent Performance for Outbound Option Dialing Campaign Calls
- Reporting on Agent Redirection on No Answer
- Reporting on Agent Call Transfers and Conferences
- Reporting on Agent Teams
- Chapter 6: Reporting on Customer Experience
- Chapter 7: Reporting on Operations
- Chapter 8: Reporting in a MultiChannel Environment
- Chapter 9: Sample Call Scenario
- Chapter 10: Reporting Implications of Data Loss and Component Failover
- Chapter 11: Troubleshooting Report Data
- Appendix A: List of All Unified ICM Report Templates
- Appendix B: Reporting Entities and Databases
- Appendix C: Configuration and Scripting for Reporting
- Configuration for Agent Reporting
- Configuring Call Types
- Configuration and Scripting for Conferences and Transfers
- Configuring Services and Enterprise Services
- Configuring and Scripting for Service Level Threshold and Type
- Configuring Short Calls
- Configuring Skill Groups and Enterprise Skill Groups
- Configuration and Scripting for the VRU
- Configuring Translation Routes
- Index

Figure 8: Icons for Graphs and Tables
Caltyp04 is a graphical report. Caltyp20 is a table.
Item and Date/Time Selections
Items
When you create a report, WebView presents a Selection list of all valid items that the report
can include. For example, when you create a Call Type report, you see a list of all Call Types
that have been configured.
From these lists, you can select a maximum of 1,000 items for the report.
Note that the naming conventions that you follow when configuring your systems can make
your selection items easier to locate. See Planning for Naming Conventions (page 60).
Time and Date Range
When you create historical reports, WebView prompts you to select the report date and time
range. The date and time range can be either relative or fixed.
Relative date and time ranges, such as Today and This Week, provide data relative to the day
you run the report.
Fixed date and time ranges, such as October 3, 2005, 09:00 to October 3, 2005, 11:59, are
specific dates and times that do not change if you run the report again at a different time.
WebView Real-Time Reports
For current activity on the status of certain statistics, select a real-time template. Real-time report
templates offer collections of real-time data based on the report category and subject and are
designated by the words "Real Time" or "Rolling 5 Minute" in their titles.
Real-time data (page 24) is collected and updated continuously and is stored in four increments
in the real-time database tables on the Admin Workstation.
WebView Historical Reports
To review past performance trends, use the historical templates. These templates are designed
to present prior contact center activity for a time interval that you define.
Historical reports have both Half Hour and Daily versions and are designated by the words
"Half Hour", "Summary" or "Daily" in their titles.
See Historical Data (page 25).
Reporting Guide for Cisco Unified ICM Enterprise & Hosted Release 7.2(1)
30
Chapter 2: Understanding Reporting
How the WebView Application Presents Reporting Data