
User Guide
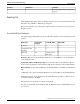
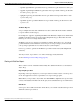
Table Of Contents
- Cover Page
- Table of Contents
- List of Figures
- Figure 1 : Central Controller
- Figure 2 : Peripheral and Peripheral Gateway
- Figure 3 : Administrative Workstation
- Figure 4 : WebView Server
- Figure 5 : Diagram of System Components
- Figure 6 : ICM Data Environment
- Figure 7 : Real-Time Data Moves to AW Local Database
- Figure 8 : Icons for Graphs and Tables
- Figure 9 : Deployment with Enterprise Routing
- Figure 10 : Sample Script for Enterprise Routing
- Figure 11 : Script Example for Agent Level Routing
- Figure 12 : Sample Script for Hybrid Routing
- Figure 13 : Agent State and Task State Relationship
- Figure 14 : Sample Routing Script for Information Gathering and Queuing
- Figure 15 : Call Type Data for Calls that Abandon after Call Type is Changed
- Figure 16 : Call Type Data for Calls that Abandon before Call Type is Changed
- Figure 17 : MultiChannel Options
- Figure 18 : Agent State Hierarchy
- Figure 19 : Call Abandoned While On Hold Scenario
- Preface
- Chapter 1: System Architecture and Reporting
- Chapter 2: Understanding Reporting
- Chapter 3: Understanding Routing and Queuing
- Chapter 4: Planning for Reporting
- Planning for Reporting at Unified ICM Setup
- Planning for Your Deployment
- Planning for Configuration and Scripting
- Planning for Agent Reporting
- Planning for Call Types
- Planning for Custom Reporting
- Planning for the HDS
- Planning for Enterprise Routing and Enterprise Reporting
- Planning for Service and Enterprise Service Reporting
- Planning for Service Level
- Planning for Short Calls
- Planning for Skill Groups and Enterprise Skill Groups
- Planning for Transfer and Conference Reporting
- Planning for Translation Routing
- Planning for Unexpected Scripting Conditions
- Planning for VRU Application Reporting
- Chapter 5: Reporting on Agents
- What Agent Data do you Want to See?
- Reporting on Agent Activity in Skill Groups
- Reporting on Agent States
- Reporting on Average Speed of Answer for Agents and Skill Groups
- Reporting on Agent Logout Reason Codes
- Reporting on Agent Not Ready Reason Codes
- Reporting on Agent Task Handling
- Reporting on Agent Performance for Outbound Option Dialing Campaign Calls
- Reporting on Agent Redirection on No Answer
- Reporting on Agent Call Transfers and Conferences
- Reporting on Agent Teams
- Chapter 6: Reporting on Customer Experience
- Chapter 7: Reporting on Operations
- Chapter 8: Reporting in a MultiChannel Environment
- Chapter 9: Sample Call Scenario
- Chapter 10: Reporting Implications of Data Loss and Component Failover
- Chapter 11: Troubleshooting Report Data
- Appendix A: List of All Unified ICM Report Templates
- Appendix B: Reporting Entities and Databases
- Appendix C: Configuration and Scripting for Reporting
- Configuration for Agent Reporting
- Configuring Call Types
- Configuration and Scripting for Conferences and Transfers
- Configuring Services and Enterprise Services
- Configuring and Scripting for Service Level Threshold and Type
- Configuring Short Calls
- Configuring Skill Groups and Enterprise Skill Groups
- Configuration and Scripting for the VRU
- Configuring Translation Routes
- Index

Each report that allows drill-down has one default drill-down report that opens directly from a
hyperlink on the report window, as well as additional drill-down sub-reports that you access by
clicking the Drill Down menu option.
Once the new report is launched, you can save it as a separate report definition. Drill-down
reports have the same dates and times defined as the report from which they were launched.
For example, the Enterprise Skill Group report summarizes data from peripheral skill groups.
You can drill down from an Enterprise Skill Group report to launch individual Peripheral Skill
Group reports to see details for the peripheral skill groups that comprise the Enterprise Skill
Group. Drill down works similarly for Enterprise Service reports.
Printing Reports
Use the Printable Version button to open a report in a new window for printing.
What prints is what you see online, and many report formats are wide. You can scale a report
in WebView before you click Printable Version. You might also want to set your printer to
print in landscape orientation and to use your printer's scaling option, if available, instead of
the WebView scaling.
Report Thresholds
Many reports allow you to set threshold values on one or more data values in the report.
Thresholds enable you to assign color to the display that highlights when certain numeric values
exceed or do not meet levels that you define. For reports that allow thresholds, you can set report
thresholds for both newly created and saved reports.
Saving Report Definitions
A report definition specifies the template that the report uses to retrieve data and any data
retrieval arguments that the report includes (such as dates, times, services, and skill groups). A
report definition does not store actual report data. You can save a report as a report definition,
and use it again as a template for other reports.
Scheduling Reports
The Job Scheduler enables you to schedule WebView reporting jobs, including printing reports
and saving reports to file, to execute at a specified date and time. You can schedule a task to be
executed once or repeatedly. For example, you could schedule a certain report to print every
Friday at 9:00 PM. You can modify the settings of existing scheduled jobs and delete scheduled
jobs that are no longer needed.
A scheduled job runs only when the user who scheduled it is logged into WebView on the
machine on which the job is scheduled at the time that the job is scheduled to run.
Report Format
Reports are presented in both graphical and tabular formats. The format is indicated by the icon
to the left of the report name:
Reporting Guide for Cisco Unified ICM Enterprise & Hosted Release 7.2(1)
29
Chapter 2: Understanding Reporting
How the WebView Application Presents Reporting Data