
User Guide
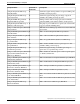


Table Of Contents
- Cover Page
- Table of Contents
- List of Figures
- Figure 1 : Central Controller
- Figure 2 : Peripheral and Peripheral Gateway
- Figure 3 : Administrative Workstation
- Figure 4 : WebView Server
- Figure 5 : Diagram of System Components
- Figure 6 : ICM Data Environment
- Figure 7 : Real-Time Data Moves to AW Local Database
- Figure 8 : Icons for Graphs and Tables
- Figure 9 : Deployment with Enterprise Routing
- Figure 10 : Sample Script for Enterprise Routing
- Figure 11 : Script Example for Agent Level Routing
- Figure 12 : Sample Script for Hybrid Routing
- Figure 13 : Agent State and Task State Relationship
- Figure 14 : Sample Routing Script for Information Gathering and Queuing
- Figure 15 : Call Type Data for Calls that Abandon after Call Type is Changed
- Figure 16 : Call Type Data for Calls that Abandon before Call Type is Changed
- Figure 17 : MultiChannel Options
- Figure 18 : Agent State Hierarchy
- Figure 19 : Call Abandoned While On Hold Scenario
- Preface
- Chapter 1: System Architecture and Reporting
- Chapter 2: Understanding Reporting
- Chapter 3: Understanding Routing and Queuing
- Chapter 4: Planning for Reporting
- Planning for Reporting at Unified ICM Setup
- Planning for Your Deployment
- Planning for Configuration and Scripting
- Planning for Agent Reporting
- Planning for Call Types
- Planning for Custom Reporting
- Planning for the HDS
- Planning for Enterprise Routing and Enterprise Reporting
- Planning for Service and Enterprise Service Reporting
- Planning for Service Level
- Planning for Short Calls
- Planning for Skill Groups and Enterprise Skill Groups
- Planning for Transfer and Conference Reporting
- Planning for Translation Routing
- Planning for Unexpected Scripting Conditions
- Planning for VRU Application Reporting
- Chapter 5: Reporting on Agents
- What Agent Data do you Want to See?
- Reporting on Agent Activity in Skill Groups
- Reporting on Agent States
- Reporting on Average Speed of Answer for Agents and Skill Groups
- Reporting on Agent Logout Reason Codes
- Reporting on Agent Not Ready Reason Codes
- Reporting on Agent Task Handling
- Reporting on Agent Performance for Outbound Option Dialing Campaign Calls
- Reporting on Agent Redirection on No Answer
- Reporting on Agent Call Transfers and Conferences
- Reporting on Agent Teams
- Chapter 6: Reporting on Customer Experience
- Chapter 7: Reporting on Operations
- Chapter 8: Reporting in a MultiChannel Environment
- Chapter 9: Sample Call Scenario
- Chapter 10: Reporting Implications of Data Loss and Component Failover
- Chapter 11: Troubleshooting Report Data
- Appendix A: List of All Unified ICM Report Templates
- Appendix B: Reporting Entities and Databases
- Appendix C: Configuration and Scripting for Reporting
- Configuration for Agent Reporting
- Configuring Call Types
- Configuration and Scripting for Conferences and Transfers
- Configuring Services and Enterprise Services
- Configuring and Scripting for Service Level Threshold and Type
- Configuring Short Calls
- Configuring Skill Groups and Enterprise Skill Groups
- Configuration and Scripting for the VRU
- Configuring Translation Routes
- Index

Trunk Group Templates
In WebView, you can report on peripheral trunk group and network trunk group data, such as
the number of trunks in service, number of trunks idle, and the time during which all trunks in
a trunk group were simultaneously busy (All Trunks Busy).
A network trunk group is a group of trunks organized to reflect the routing client's view of
trunks. A network trunk group can map to one or more trunk groups.
A peripheral trunk group is a collection of trunks associated with a single peripheral. Often, the
trunks in a peripheral trunk group are used for a common purpose.
Network
DescriptionHistorical or
Real-Time
Template Name
Table that shows the status of trunks in selected network
trunk groups.
Rnettrk01: Network Trunk Group Status
Real Time
Table that shows network trunk group status for the current
interval.
Rnettrk02: Network Trunk Group
Performance Real Time
Table of all fields real time data for trunks in selected network
trunk groups.
Rnettrk03: Network Trunk Group Real
Time All Fields
Table that shows half-hour historical data of trunks in selected
network trunk groups.
Hnettrk12: Network Trunk Group Report
Half Hour
Table of all fields data for trunks in selected network trunk
groups by Half Hour
Hnettrk13: Network Trunk Group
Historical All Fields
Peripheral
DescriptionHistorical or
Real-Time
Template Name
Bar graph of the time (in seconds) that all trunks were busy
since the end of the last half-hour interval.
Rtrkgrp01: All Trunks Busy Real Time
Overlapped bar graph of the current number of idle trunks
versus the current number of in-service trunks.
Rtrkgrp02: Trunks Idle & In Service
Real Time
Table showing counts of trunks in-service, trunks idle, and
time in seconds that all trunks are busy
Rtrkgrp03: Trunk Group Status Real
Time .
Table of all fields real time data for trunk groups.Rtrkgrp04: Trunks Real Time All Fields
Table of half-hour counts of trunks in-service, trunks idle,
and the seconds that all trunks were busy.
Htrkgrp11: Trunk Group Performance
Half Hour
Table of all fields data for trunk groups by Half Hour.Htrkgrp12: Trunks Historical All Fields
Reporting Guide for Cisco Unified ICM Enterprise & Hosted Release 7.2(1)
182
List of All Unified ICM Report Templates
Trunk Group Templates