
User Guide
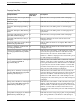
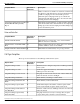
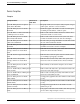
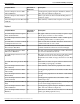

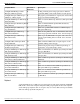
Table Of Contents
- Cover Page
- Table of Contents
- List of Figures
- Figure 1 : Central Controller
- Figure 2 : Peripheral and Peripheral Gateway
- Figure 3 : Administrative Workstation
- Figure 4 : WebView Server
- Figure 5 : Diagram of System Components
- Figure 6 : ICM Data Environment
- Figure 7 : Real-Time Data Moves to AW Local Database
- Figure 8 : Icons for Graphs and Tables
- Figure 9 : Deployment with Enterprise Routing
- Figure 10 : Sample Script for Enterprise Routing
- Figure 11 : Script Example for Agent Level Routing
- Figure 12 : Sample Script for Hybrid Routing
- Figure 13 : Agent State and Task State Relationship
- Figure 14 : Sample Routing Script for Information Gathering and Queuing
- Figure 15 : Call Type Data for Calls that Abandon after Call Type is Changed
- Figure 16 : Call Type Data for Calls that Abandon before Call Type is Changed
- Figure 17 : MultiChannel Options
- Figure 18 : Agent State Hierarchy
- Figure 19 : Call Abandoned While On Hold Scenario
- Preface
- Chapter 1: System Architecture and Reporting
- Chapter 2: Understanding Reporting
- Chapter 3: Understanding Routing and Queuing
- Chapter 4: Planning for Reporting
- Planning for Reporting at Unified ICM Setup
- Planning for Your Deployment
- Planning for Configuration and Scripting
- Planning for Agent Reporting
- Planning for Call Types
- Planning for Custom Reporting
- Planning for the HDS
- Planning for Enterprise Routing and Enterprise Reporting
- Planning for Service and Enterprise Service Reporting
- Planning for Service Level
- Planning for Short Calls
- Planning for Skill Groups and Enterprise Skill Groups
- Planning for Transfer and Conference Reporting
- Planning for Translation Routing
- Planning for Unexpected Scripting Conditions
- Planning for VRU Application Reporting
- Chapter 5: Reporting on Agents
- What Agent Data do you Want to See?
- Reporting on Agent Activity in Skill Groups
- Reporting on Agent States
- Reporting on Average Speed of Answer for Agents and Skill Groups
- Reporting on Agent Logout Reason Codes
- Reporting on Agent Not Ready Reason Codes
- Reporting on Agent Task Handling
- Reporting on Agent Performance for Outbound Option Dialing Campaign Calls
- Reporting on Agent Redirection on No Answer
- Reporting on Agent Call Transfers and Conferences
- Reporting on Agent Teams
- Chapter 6: Reporting on Customer Experience
- Chapter 7: Reporting on Operations
- Chapter 8: Reporting in a MultiChannel Environment
- Chapter 9: Sample Call Scenario
- Chapter 10: Reporting Implications of Data Loss and Component Failover
- Chapter 11: Troubleshooting Report Data
- Appendix A: List of All Unified ICM Report Templates
- Appendix B: Reporting Entities and Databases
- Appendix C: Configuration and Scripting for Reporting
- Configuration for Agent Reporting
- Configuring Call Types
- Configuration and Scripting for Conferences and Transfers
- Configuring Services and Enterprise Services
- Configuring and Scripting for Service Level Threshold and Type
- Configuring Short Calls
- Configuring Skill Groups and Enterprise Skill Groups
- Configuration and Scripting for the VRU
- Configuring Translation Routes
- Index

DescriptionHistorical or
Real-Time
Template Name
Table of task count daily totals, queue delay time daily totals,
and service level daily averages.
Hentsvc11: Tasks Analysis of Enterprise
Services Daily
Table of task count and queue delay time half-hour totals,
and service level half-hour totals.
Hentsvc12: Tasks Analysis of Enterprise
Services Half Hour
Overlapped bar graph that shows the number of tasks offered
per day.
Hentsvc13: Enterprise Service Tasks
Offered Daily
Overlapped bar graph that shows the number of tasks handled
per day.
Hentsvc14: Enterprise Service Tasks
Handled Daily
Overlapped bar graph that shows the number of tasks
abandoned per day.
Hentsvc15: Enterprise Service Tasks
Abandoned Daily
Line graph of tasks abandoned, handled, and offered per day
(for use with a single enterprise service).
Hentsvc16: Enterprise Service History
Daily
Overlapped bar graph showing the distribution (number) of
tasks offered at a half-hour sample rate.
Hentsvc17: Enterprise Service Tasks
Offered Half Hour
Table report that shows historical task handling data for a
collection of gates.
Hentsvc18: Enterprise Gate Analysis
Half Hour
Table summary of all historical enterprise service fieldsHentsvc24: Enterprise Service Historical
All Fields
Skill Group Templates
Skill group reports provide performance metrics on a collection of agents who share a common
set of skills, such as all agents who are skilled to handle English speaking callers.
Base Only
The base skill group reports are the same as the peripheral skill group reports, except that all
base skill group tabular reports allow you to launch drill-down reports from within the current
report window.
A drill-down report is a detailed sub-report from within the current report window.
DescriptionHistorical or
Real-Time
Template Name
Stacked bar graph showing numbers of agents in talking,
idle, available, and wrap-up states.
Rperskg01: Peripheral Skill Group
Status Real Time
Stacked bar graph showing the percentage of agents in
available, idle, talking, and wrap-up states.
Rperskg03: Peripheral Skill Group
Agent State Status
Rolling 5-minute table showing agent states in full-time
equivalent (FTE) counts and the number of tasks queued.
Rperskg04: ICM Rolling 5-minute
Peripheral Skill Group Status
Bar graph of percent utilization of agents (ratio between time
logged on and time handling calls).
Rperskg05: Peripheral Skill Group %
Utilization of Ready Agents
Reporting Guide for Cisco Unified ICM Enterprise & Hosted Release 7.2(1)
178
List of All Unified ICM Report Templates
Skill Group Templates