
User Guide
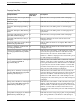
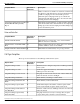
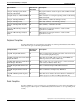
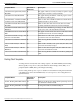
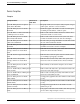
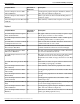

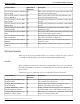
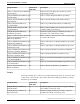
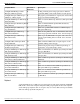
Table Of Contents
- Cover Page
- Table of Contents
- List of Figures
- Figure 1 : Central Controller
- Figure 2 : Peripheral and Peripheral Gateway
- Figure 3 : Administrative Workstation
- Figure 4 : WebView Server
- Figure 5 : Diagram of System Components
- Figure 6 : ICM Data Environment
- Figure 7 : Real-Time Data Moves to AW Local Database
- Figure 8 : Icons for Graphs and Tables
- Figure 9 : Deployment with Enterprise Routing
- Figure 10 : Sample Script for Enterprise Routing
- Figure 11 : Script Example for Agent Level Routing
- Figure 12 : Sample Script for Hybrid Routing
- Figure 13 : Agent State and Task State Relationship
- Figure 14 : Sample Routing Script for Information Gathering and Queuing
- Figure 15 : Call Type Data for Calls that Abandon after Call Type is Changed
- Figure 16 : Call Type Data for Calls that Abandon before Call Type is Changed
- Figure 17 : MultiChannel Options
- Figure 18 : Agent State Hierarchy
- Figure 19 : Call Abandoned While On Hold Scenario
- Preface
- Chapter 1: System Architecture and Reporting
- Chapter 2: Understanding Reporting
- Chapter 3: Understanding Routing and Queuing
- Chapter 4: Planning for Reporting
- Planning for Reporting at Unified ICM Setup
- Planning for Your Deployment
- Planning for Configuration and Scripting
- Planning for Agent Reporting
- Planning for Call Types
- Planning for Custom Reporting
- Planning for the HDS
- Planning for Enterprise Routing and Enterprise Reporting
- Planning for Service and Enterprise Service Reporting
- Planning for Service Level
- Planning for Short Calls
- Planning for Skill Groups and Enterprise Skill Groups
- Planning for Transfer and Conference Reporting
- Planning for Translation Routing
- Planning for Unexpected Scripting Conditions
- Planning for VRU Application Reporting
- Chapter 5: Reporting on Agents
- What Agent Data do you Want to See?
- Reporting on Agent Activity in Skill Groups
- Reporting on Agent States
- Reporting on Average Speed of Answer for Agents and Skill Groups
- Reporting on Agent Logout Reason Codes
- Reporting on Agent Not Ready Reason Codes
- Reporting on Agent Task Handling
- Reporting on Agent Performance for Outbound Option Dialing Campaign Calls
- Reporting on Agent Redirection on No Answer
- Reporting on Agent Call Transfers and Conferences
- Reporting on Agent Teams
- Chapter 6: Reporting on Customer Experience
- Chapter 7: Reporting on Operations
- Chapter 8: Reporting in a MultiChannel Environment
- Chapter 9: Sample Call Scenario
- Chapter 10: Reporting Implications of Data Loss and Component Failover
- Chapter 11: Troubleshooting Report Data
- Appendix A: List of All Unified ICM Report Templates
- Appendix B: Reporting Entities and Databases
- Appendix C: Configuration and Scripting for Reporting
- Configuration for Agent Reporting
- Configuring Call Types
- Configuration and Scripting for Conferences and Transfers
- Configuring Services and Enterprise Services
- Configuring and Scripting for Service Level Threshold and Type
- Configuring Short Calls
- Configuring Skill Groups and Enterprise Skill Groups
- Configuration and Scripting for the VRU
- Configuring Translation Routes
- Index
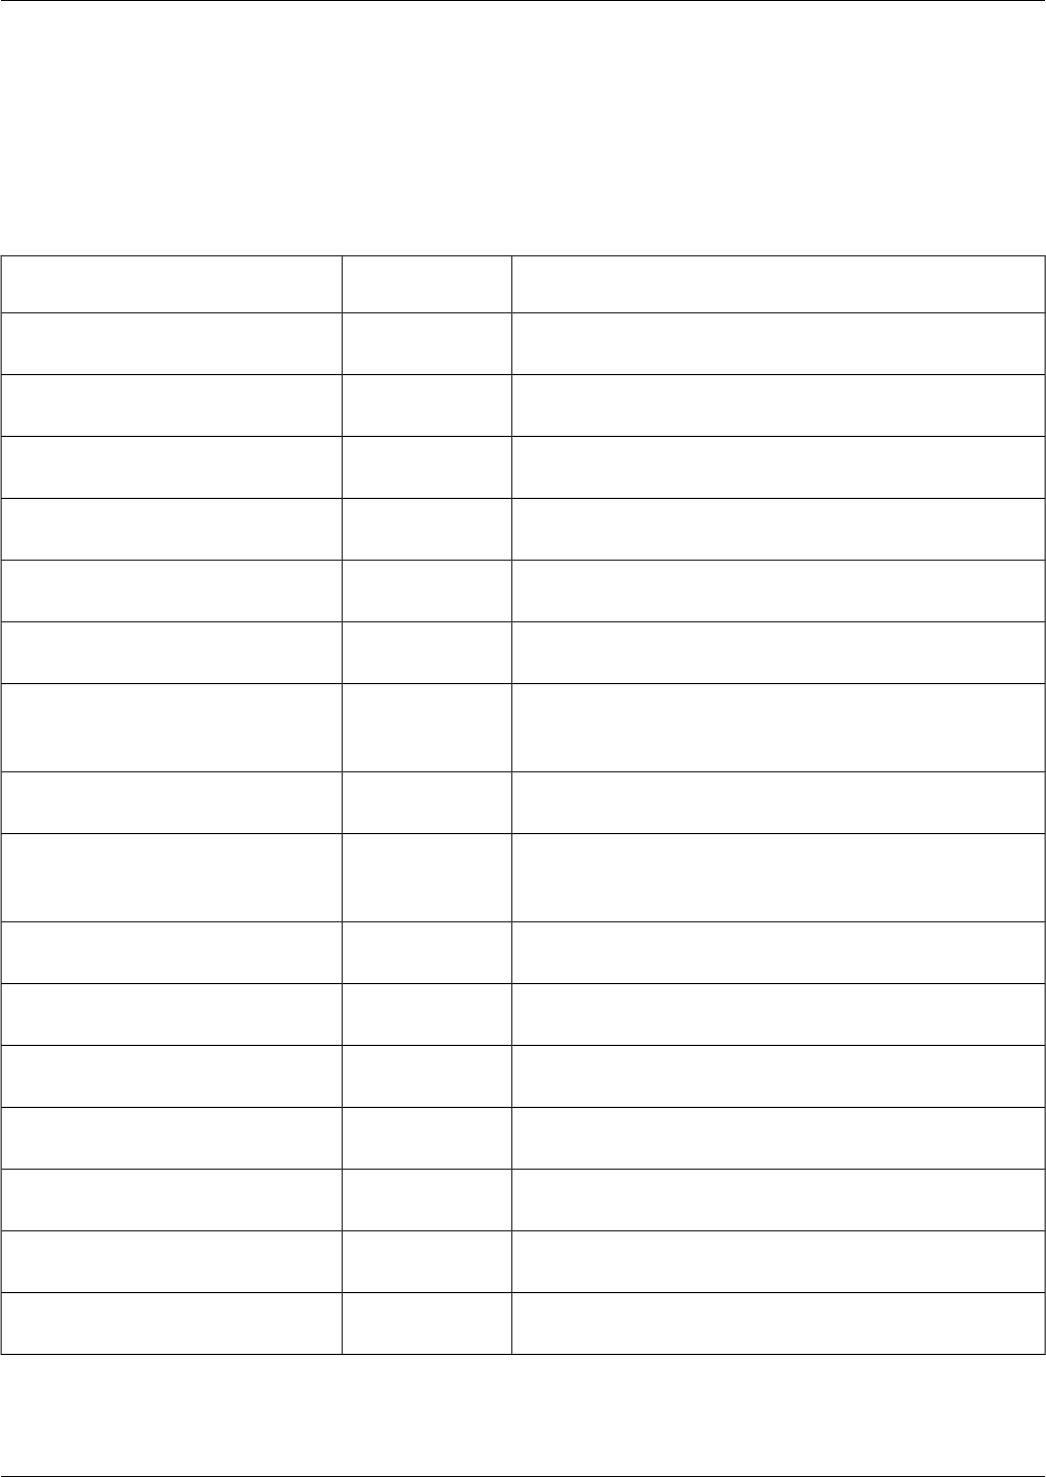
Service Templates
Enterprise
DescriptionHistorical or
Real-Time
Template Name
Bar graph of time (in seconds) for delays in queue, longest
task in queue, and ASA over last 5 minutes.
Rentsvc01: Enterprise Service Queue
Delay Status Real Time
Stacked bar graph of the number of tasks on which agents
are talking and the number of tasks in queue.
Rentsvc02: Enterprise Service Status
Real Time
Table of tasks offered, handled, abandoned, and the effect
of abandoned tasks on service levels.
Rentsvc03: Effect of Abandoned Tasks
on Enterprise Service Levels
Table of task counts and service levels (since end of last
5-minute and half-hour intervals, and since midnight).
Rentsvc04: Enterprise Service Tasks
Trend Analysis Real Time
Pie chart of the percentage distribution of tasks offered since
the end of the last half-hour interval.
Rentsvc05: Enterprise Service Tasks
Offered Over Half Hour
Bar graph of service levels since the end of the last 5-minute
and half-hour intervals, and since midnight.
Rentsvc06: Enterprise Service Levels
Real Time
Table that shows task counts, queue status, and service levels
in real-time and for the last 5 minutes.
Rentsvc07: Enterprise Service Tasks,
Averages and Service Levels Real
Time
Table that shows task and queue status in real-time where
service/skillgroup mapping is available.
Rentsvc08: Task and Agent Status Real
Time
Table that shows Service Array task counts, queue status,
and service levels in real-time and for the last 5 minutes.
Rentsvc09: Service Array Tasks,
Averages and Service Levels Real
Time
Table summary of all real time enterprise service fieldsRentsvc23: Enterprise Service Real
Time All Fields
Table of task count daily totals, queue delay time daily totals,
and service level daily averages.
Hentsvc11: Tasks Analysis of Enterprise
Services Daily
Table of task count and queue delay time half-hour totals,
and service level half-hour totals.
Hentsvc12: Tasks Analysis of Enterprise
Services Half Hour
Overlapped bar graph that shows the number of tasks offered
per day.
Hentsvc13: Enterprise Service Tasks
Offered Daily
Overlapped bar graph that shows the number of tasks handled
per day.
Hentsvc14: Enterprise Service Tasks
Handled Daily
Overlapped bar graph that shows the number of tasks
abandoned per day.
Hentsvc15: Enterprise Service Tasks
Abandoned Daily
Line graph of tasks abandoned, handled, and offered per day
(for use with a single enterprise service).
Hentsvc16: Enterprise Service History
Daily
Reporting Guide for Cisco Unified ICM Enterprise & Hosted Release 7.2(1)
175
List of All Unified ICM Report Templates
Service Templates