
White Paper


Wireless LAN Design Guide for High Density
Client Environments in Higher Education
9 © 2011 Cisco and/or its affiliates. All rights reserved.
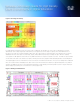
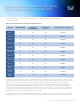
)LJXUH0L[HG:LUHOHVV&OLHQW3URWRFRO3HUIRUPDQFHLQD&HOODJQGDWDUDWHV
The graph above shows throughput rates under varying mixes of HT20 modulation coding scheme-15 (MCS15) 2SS data rates
and legacy 802.11a/g (for the purpose of this discussion 802.11a and 802.11g are the same protocol – different bands and are
considered equal) data rates within a single isolated cell.
• With either all MCS15 or all 802.11a/g clients, the difference in throughput is 480 percent
• With a 50/50 mix, there is a 400 percent increase over legacy throughput
• With a drop to just 25 percent of MCS15 clients, the increase is 300 percent
In this example using 30 connections, the application throughput to the end user would be 833 Kbps with all legacy connections
or 3.9 Mbps with all 802.11n connections. A mix drives throughput down. Other variables, such as user density or environmental
noise, can and likely will change over time and will effect the throughput as well.
1XPEHURIFOLHQWV
7KURXJKSXWRISHUFOLHQW0ESV
7KURXSXWRI PL[HG D DQGQF OLHQWV ZLWK576&76
Q
Q
Q
Q
D