
White Paper


Wireless LAN Design Guide for High Density
Client Environments in Higher Education
31 © 2011 Cisco and/or its affiliates. All rights reserved.
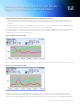
7KHVHGHSOR\PHQWVUHVXOWHGLQVLJQLILFDQWO\GLIIHUHQWXVHUH[SHULHQFHVLQHDFKURRP
• Room A did not have an even balance of clients on all six of the APs, with a pronounced number staying on the AP that
was near the entrance to the room indicating that they never roamed. Performance was moderate, but there were no user
complaints.
• Room B had a much more balanced load distributed across all the APs in the room and performance was significantly better,
as indicated by the throughput observed in the room and on the network supplying it.
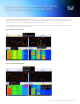
Reviewing the duty cycle in the two rooms from the same period, there was a significant difference in the RF conditions between
room A and B. Over a 10 minute period, the duty cycle for channels 6,11 in Room A averaged near 100%, and channel 1
exhibited spikes of 100%, as shown in Figure 16.
)LJXUH'XW\&\FOH5HVXOWVLQ5RRP$
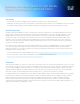
Over a 10 minute period, the duty cycle for channels 1,6,11 in Room B averaged 50 percent with brief spikes of 70%, Figure 17.
)LJXUH7ZRURRP+LJKGHQVLW\:/$1
The duty cycle measures the actual RF utilization; it is the percentage of time Tx is active for a given frequency. Channel
utilization is different, and normally a higher value than RF duty cycle as it adds protocol timers into the metric to show overall
Wi-fi channel availability. By adding the contention window minimum (CW_min), network allocation vector (NAV) and CCA high