
Manual


HTTPError Tracking User Guide
Setting the Time Range for Displayed Data
The information displayed on the HTTPErrors tab always corresponds to a specific
time range. Before you explore data on the tab, it is important to determine
whether the range is set properly, and to reset it as necessary.
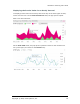
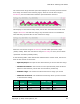
The time range selector in the boxeslabeled 1 in the following figure controls the
time period for which data is displayed on the tab as a whole (referred to here-
after as the overall time range). The overall time range is set in the upper of the
two boxes and reported in the lowerone. See "Setting the Overall Time Range" on
the next page.
Optionally, you can use the time range selector in box 2 to set a different time
range for the HTTPTransactions and HTTPTraffic line charts, which appear below
it. (Note, however, that each time you change a setting in the left half of the main
pane—for example, switching between the list or services and the list of devices,
changing which column controls the sort order, or selecting an individual service
or device—the time range set in box2 resets to match the overall time range.)
See "Setting the Time Range for the Line Charts" on the next page.
Copyright © 2014, Cisco Systems, Inc. 19