
Manual

HTTPError Tracking User Guide
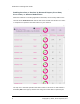
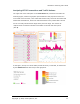
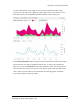
In the HTTPTraffic chart, the solid line represents traffic volume during the selec-
ted time range. The meaning of the dotted line depends on the length of the selec-
ted time range. If the range is less than seven days, the dotted line represents
the same hours and days of the week as the selected time range, but one week
previous. In other words, if the selected time range covers 24hours on 22 June,
the dotted line covers 24hours on 15June. If the selected time range is
eightdays or more, the dotted line represents the period of time of the same dur-
ation as the selected time range that immediately preceded the selected time
range.
14 Copyright © 2014, Cisco Systems, Inc.