
Manual

HTTPError Tracking User Guide
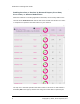
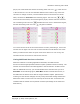
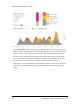
The fields below the title report the following information:
l Est Subscribers Affected—Estimated number of unique subscribers whose
requests to the service resulted in errors (in services view), or who used
the type of device that received errors from a service (in devices view).
l Error rate—Percentage of HTTP transactions with the service or device that
resulted in errors. The value matches the second column of the selected
row in the summary table.
l Number Locations—Number of distribution centers currently selected in the
left-hand filter above the summary table (box 1 in the first figure in this sec-
tion), followed by a list of their names. The value AllLocations indicates
that no location filter is applied. The charts on the right side of the pane
include data for these locations only.
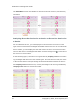
l Number Devices—Number of device models currently selected in the in the
right-hand filter above the summary table (box 1 in the first figure in this
section), followed by a list of their names. The value AllDevices indicates
that no device filter is applied. The charts on the right side of the pane
include data for these devices only.
The graph immediately to the right of the fields represents the proportion of
HTTPtransactions that were successful (green) or had errors (red). The next
graph to the right shows the proportion of total errors accounted for by the five
errors that occurred most, with the bottom gray bar representing all other errors.
For further information, see the following sections:
l
"Tracking HTTP Transactions and Traffic" below
l
"Displaying the Precise Value for an Hourly Interval" on page15
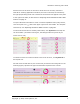
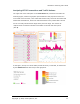
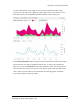
Tracking HTTP Transactions and Traffic
The HTTPTransactions and HTTPTraffic line charts track those statistics for hourly
intervals during the selected time range, which is reported in the time range
selector above them. By default, the time range matches the time range that is
set for the tab overall, but you can set an independent range for the line charts.
For instructions, see "Setting the Time Range for Displayed Data" on page1.
12 Copyright © 2014, Cisco Systems, Inc.