
Manual

HTTPError Tracking User Guide
Analyzing HTTP Transactions and Traffic Volume
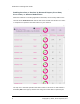
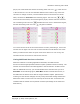
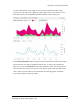
The right side of the main pane on the HTTPErrors tab, enclosed in box3 in the
following figure, features a graphic representation of the proportion of the five
errors that occurred most, a line chart that tracks hourly counts of successful and
failed HTTP transactions, and a line chart that tracks hourly HTTPtraffic volume
for the currently selected time range and a previous range. The values cor-
respond to the row that is selected in the table on the left side of the pane
(box2).
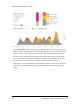
In the figure, the top row of the table (all 500services) is selected, as confirmed
by the 500Services title at the top of the right pane.
Copyright © 2014, Cisco Systems, Inc. 11