
Manual

HTTPError Tracking User Guide
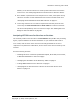
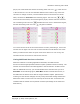
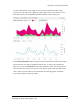
purple, non-underlined font and the increasing-order sort icon ( ) in the left cell
in the second row. You can sort the table based on the values in any of the four
columns. To change columns, click the statistic name in the second row of the
table, as shown for ErrorRate in the following figure. The sort icon ( or )
moves to the new column, the font changes to purple, and the rows are resorted.
The increasing-order sort icon ( ) indicates the sort order is smallest to largest,
and the decreasing-order sort icon ( ) largest to smallest.
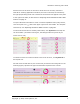
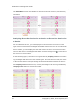
To reverse the sort order of the column that is currently controlling it, click in the
second-row cell again. The sort icon reverses direction to indicate the neworder.
When you switch to the other list (from services to devices or vice versa), the
sort basis for the current list is used for the new list.
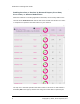
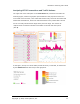
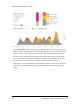
Listing Additional Services or Devices
When the HTTPError Tracking application initializes, the table lists the
50services with largest potential network impact (smallest numerical ranks). The
number of entries listed in the table appears in the box below it. If data is avail-
able for additional services, you can add another 50to list each time you click
ShowMore. In the following figure, ShowMore has been clicked three times, so
the table lists the 200services with the largest network impact. (Because the
ordering of rows has not changed, the only easily discernible change outside the
bottom box itself is to the oval icon at the top of the scroll bar: its smaller size
indicates that the visible rows represent a smaller percentage of the total rows
than before.)
Copyright © 2014, Cisco Systems, Inc. 9