
Manual

HTTPError Tracking User Guide
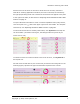
l Network Impact Rank—Indicates the level of potential negative effect on net-
work operations caused by errors generated by the service (or received by
devices of the model type). The algorithm for calculating the rank considers
two statistics for each service or device model:
l The percentage of total errors (from all services or devices) it
accounts for
l Its average traffic volume per flow compared to the overall volume of
HTTP traffic
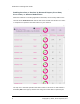
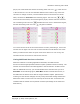
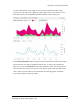
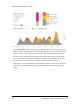
l Error Rate—Specifies the percentage of HTTP transactions that resulted in
errors. The ring chart that surrounds the numerical value graphically rep-
resents the proportion of successful (green) and failed (red) transactions.
l HTTP Errors—Specifies the number of HTTP errors generated by the service
or received by devices of the model type.
l Subs Impacted—Specifies the number of subscribers using the service or
device who were affected by the errors.
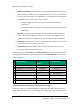
For the values in the HTTPErrors and SubsImpacted columns, the letter following
the digits indicates the multiple, as specified in the CountStatistics column of the
followingtable.
Rate Statistics
Volume Stat-
istics
Count Statistics
K
kilobits per second (Kbps) kilobytes thousands (10
3
)
M
megabits per second (Mbps) megabytes millions (10
6
)
G
gigabits per second (Gbps) gigabytes –
B
– – billions (10
9
)
T
terabits per second (Tbps) terabytes trillions (10
12
)
P
petabits per second (Pbps) petabytes –
Q
– – quadrillions (10
15
)
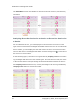
Changing the Sort Order in the Summary Table
When the HTTPError Tracking application initializes, the table ranks services by
their network impact score, in increasing order starting with1, as indicated by the
8 Copyright © 2014, Cisco Systems, Inc.