
Manual

HTTPError Tracking User Guide
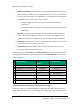
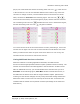
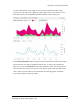
24hours from 00:00hours on 22June to 00:00hours on 23June). When the
HTTPError Tracking application initializes, this row is selected, as indicated by
the light purple background color. Details for the selected row appear in the pane
to the right of the table, as discussed in "Analyzing HTTP Transactions and Traffic
Volume" on page11.
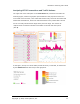
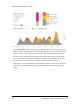
To export the data in the table to a file in comma-separated value (CSV) format,
click the export icon ( ) above the upper right corner of the table. For complete
instructions, see "Exporting HTTP Error Data to a File" on page25.
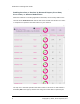
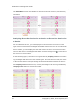
To list the devices that were used by subscribers, click byDevices in the top left
cell of the table. (As shown in the figure, the background turns yellow as you
mouse over a row.)
To switch from the list of devices back to the list of services, click byServices in
the top left cell.
For both services and devices, the second row (enclosed in the orange box in the
following figure) specifies the type of information reported in the column.
Copyright © 2014, Cisco Systems, Inc. 7