
Manual

HTTPError Tracking User Guide
default) or the devices which were used by subscribers that received the
most errors. See "Analyzing HTTP Errors for Services or Devices" below.
5.
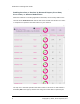
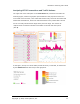
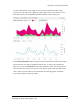
Error details—Specifies the most frequent error codes, and reports hourly
values for number of HTTP transactions and volume of HTTP traffic. See
"Analyzing HTTP Transactions and Traffic Volume" on page11.
6.
Time range selector for line charts—Reports and sets the period of time
covered by the HTTP Transactions and HTTPTraffic line charts in box5. It
can be set independently of the overall time range. See "Setting the Time
Range for the Line Charts" on page20.
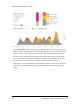
Analyzing HTTP Errors for Services or Devices
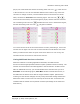
The summary table on the left side of the HTTPErrors tab (box4 in the preceding
figure) reports statistics for HTTP transactions on your network that result in
error codes, both in terms of the web services that generated the errors in
response to requests from subscribers, and in terms of the devices used by sub-
scribers.
See the following sections:
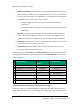
l
"Ranking Services or Devices by Network Impact, Error Rate, Error Count,
or Affected Subscribers" on the next page
l
"Changing the Sort Order in the Summary Table" on page8
l
"Listing Additional Services or Devices" on page9
l
"Analyzing Errors Per Device for a Service or Errors Per Service for a
Device" on page10
Copyright © 2014, Cisco Systems, Inc. 5