HTTP Error Tracking User Guide Version 3.4 Published: 2014-10-02 Copyright © 2014, Cisco Systems, Inc.
HTTP Error Tracking User Guide Americas Headquarters Cisco Systems, Inc. 170 West Tasman Drive San Jose, CA 95134-1706 USA http://www.cisco.com Tel: 408 526-4000 800 553-NETS (6387) Fax: 408 527-0883 3 Copyright © 2014, Cisco Systems, Inc.
HTTP Error Tracking User Guide THE SPECIFICATIONS AND INFORMATION REGARDING THE PRODUCTS IN THIS MANUAL ARE SUBJECT TO CHANGE WITHOUT NOTICE. ALL STATEMENTS, INFORMATION, AND RECOMMENDATIONS IN THIS MANUAL ARE BELIEVED TO BE ACCURATE BUT ARE PRESENTED WITHOUT WARRANTY OF ANY KIND, EXPRESS OR IMPLIED. USERS MUST TAKE FULL RESPONSIBILITY FOR THEIR APPLICATION OF ANY PRODUCTS.
HTTP Error Tracking User Guide Table of Contents Introducing HTTP Error Tracking HTTP Errors Navigating the Landing Page 1 Analyzing HTTP Errors 3 Navigating the HTTP Errors Tab 4 Analyzing HTTP Errors for Services or Devices 5 Analyzing HTTP Transactions and Traffic Volume 11 Controlling the HTTP Errors Session 17 Setting the Time Range for Displayed Data 19 Setting the Overall Time Range 20 Setting the Time Range for the Line Charts 20 Exporting HTTP Error Data to a File 5 1 25 Copy
HTTP Error Tracking User Guide Introducing HTTP Error Tracking HTTP Errors The HTTP Error Tracking application provides information about the Hypertext Transfer Protocol (HTTP) error codes sent by web services in response to requests from subscribers on your network. Your technical operations team can use the data to track the success of subscriber sessions, enabling you to deliver proactive customer care, to reduce operating expenses, and to glean insight into the performance of specific mobile devices.
HTTP Error Tracking User Guide information about the HTTP Errors tab, see "Analyzing HTTP Errors" on page 3. l The Configuration tab provides the interface for administering user accounts. See the Cisco MURAL User Guide. The right end of the title bar provides interfaces for obtaining status information and controlling the session: l Welcome username—Names the user logged in to this Mural session. In the figure, it is admin.
Analyzing HTTP Errors The HTTP Errors tab in the HTTP Error Tracking application provides information about the Hypertext Transfer Protocol (HTTP) error codes sent by web services in response to requests from subscribers on your network.
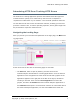
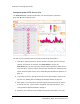
HTTP Error Tracking User Guide Navigating the HTTP Errors Tab The HTTP Errors tab is divided functionally into several panes, numbered 1 through 6 in the following figure. The panes in the numbered boxes provide the following functionality: 1. HTTP Error Tracking title bar—On the left side, provides access to the specialized information on each tab (click HTTP Errors to access the HTTP Errors tab).
HTTP Error Tracking User Guide default) or the devices which were used by subscribers that received the most errors. See "Analyzing HTTP Errors for Services or Devices" below. 5. Error details—Specifies the most frequent error codes, and reports hourly values for number of HTTP transactions and volume of HTTP traffic. See "Analyzing HTTP Transactions and Traffic Volume" on page 11. 6.
HTTP Error Tracking User Guide Ranking Services or Devices by Network Impact, Error Rate, Error Count, or Affected Subscribers When the HTTP Error Tracking application initializes, the summary table on the left side of the HTTP Errors tab lists the web services that sent HTTP error codes in response to requests from subscribers on your network.
HTTP Error Tracking User Guide 24 hours from 00:00 hours on 22 June to 00:00 hours on 23 June). When the HTTP Error Tracking application initializes, this row is selected, as indicated by the light purple background color. Details for the selected row appear in the pane to the right of the table, as discussed in "Analyzing HTTP Transactions and Traffic Volume" on page 11.
HTTP Error Tracking User Guide l Network Impact Rank—Indicates the level of potential negative effect on network operations caused by errors generated by the service (or received by devices of the model type).
HTTP Error Tracking User Guide purple, non-underlined font and the increasing-order sort icon ( ) in the left cell in the second row. You can sort the table based on the values in any of the four columns. To change columns, click the statistic name in the second row of the table, as shown for Error Rate in the following figure. The sort icon ( or ) moves to the new column, the font changes to purple, and the rows are resorted.
HTTP Error Tracking User Guide The Show More function is available for devices as well as services, and with any sort basis. Analyzing Errors Per Device for a Service or Errors Per Service for a Device For an individual service, you can display the rate and count of errors for each type of device model that exchanged HTTP data with the service. For an individual device model, you can display the rate and count of errors it received from each service with which it exchanged HTTP data.
HTTP Error Tracking User Guide Analyzing HTTP Transactions and Traffic Volume The right side of the main pane on the HTTP Errors tab, enclosed in box 3 in the following figure, features a graphic representation of the proportion of the five errors that occurred most, a line chart that tracks hourly counts of successful and failed HTTP transactions, and a line chart that tracks hourly HTTP traffic volume for the currently selected time range and a previous range.
HTTP Error Tracking User Guide The fields below the title report the following information: l Est Subscribers Affected—Estimated number of unique subscribers whose requests to the service resulted in errors (in services view), or who used the type of device that received errors from a service (in devices view). l Error rate—Percentage of HTTP transactions with the service or device that resulted in errors. The value matches the second column of the selected row in the summary table.
HTTP Error Tracking User Guide To export the data for either chart to a file in comma-separated value (CSV) format, click the export icon ( ) at the upper right corner of the chart. For com- plete instructions, see "Exporting HTTP Error Data to a File" on page 25. In the HTTP Transactions chart, the green region represents successful HTTP transactions and the red region transactions with errors. To track only transactions with errors, click the isolate errors check box to add the check.
HTTP Error Tracking User Guide In the HTTP Traffic chart, the solid line represents traffic volume during the selected time range. The meaning of the dotted line depends on the length of the selected time range. If the range is less than seven days, the dotted line represents the same hours and days of the week as the selected time range, but one week previous. In other words, if the selected time range covers 24 hours on 22 June, the dotted line covers 24 hours on 15 June.
HTTP Error Tracking User Guide Displaying the Precise Value for an Hourly Interval To display precise values for an hourly interval on any of the three types of chart, mouse over the hour. On the HTTP Transactions chart, the pop-up box reports both errors and successes. On the HTTP Traffic chart, the pop-up box reports the value for the moused-over line (in the figure, the value for the Previous line). Copyright © 2014, Cisco Systems, Inc.
HTTP Error Tracking User Guide Controlling the HTTP Errors Session The right-hand portion of the HTTP Errors title bar reports status information for the current session. l Welcome username—Names the user logged in to this HTTP Error Tracking session. In the figure, it is admin. l About HTTP Error Tracking—Opens a pop-up window with information about this version of the HTTP Error Tracking application. l Help—Opens a new browser window to display help topics.
HTTP Error Tracking User Guide Setting the Time Range for Displayed Data The information displayed on the HTTP Errors tab always corresponds to a specific time range. Before you explore data on the tab, it is important to determine whether the range is set properly, and to reset it as necessary. The time range selector in the boxes labeled 1 in the following figure controls the time period for which data is displayed on the tab as a whole (referred to hereafter as the overall time range).
HTTP Error Tracking User Guide HTTP Error Tracking uses the 24-hour clock to represent times; for example, 00:00 hours is midnight and 18:00 hours is 6 PM. Setting the Overall Time Range The following figure depicts the overall time range selector in the upper of the boxes labeled 1 in the preceding figure. To set the overall time range to one of the listed durations, click the name of the duration. The term in purple is the currently selected time range (last 24 hours in the following example).
HTTP Error Tracking User Guide The custom time range interface opens and displays the currently selected overall time range. As shown in the following figure, when the overall time range is last 24 hours, the full width of the interface represents those 24 hours. This display is referred to as daily mode, and is also used when the overall time range is last 6 hours. For that time range, only the final 6 hours are unshaded to show that they represent the current overall time range.
HTTP Error Tracking User Guide Mode Span dis- Marked incre- played ments Monthly 60 days 1 day Settable range 1 – 60 days Minimum increment 1 day To set the time range for the charts, perform the following procedure: 1. Determine whether the desired start time and end time for the time range appears in the range selector. If not, shift the time span in the desired direction by clicking on the appropriate box with single or double arrows at the end of the selector.
HTTP Error Tracking User Guide l To set the end time, mouse over the triangle that appears below the current end time, then use the same instructions as for the start time. l To move the time range without changing its duration, mouse over the thin bar between the start and end triangles. A dark gray box appears below the bar and reports the start and end times. Press and hold the left mouse button as you slide the bar right or left. 3.
HTTP Error Tracking User Guide Exporting HTTP Error Data to a File You can export the data presented in the summary table and the two line charts on the HTTP Errors tab to a file in comma-separated values (CSV) format. To export the data: 1. Click the export icon ( ) above the upper right corner of a table or chart (enclosed in the orange boxes in the following figure). 2. Click in the box that pops up. The following figure is for the summary table in services view.
HTTP Error Tracking User Guide A new window pops up to display the CSV-formatted text. There are three points to note: l The values in the first row act as column headers, specifying the type of value in the corresponding position in the following rows (service name in the first field, in the second field, and so on). l The data includes all entities used to generate the chart or table, not just the ones that are currently visible on the tab.
HTTP Error Tracking User Guide 3. To save the data in the window to a file, click the SAVE button. In the file system window that pops up, choose the directory location and change the default name (export.csv) if desired. To close the window without writing the data to a file, click the CLOSE button or the close-window icon ( ) on the title bar. Copyright © 2014, Cisco Systems, Inc.