
Design Guide

162
Cisco Aironet 1520, 1130, 1240 Series Wireless Mesh Access Points, Design and Deployment Guide, Release 6.0
OL-20213-01
Adding and Managing Mesh Access Points with Cisco WCS
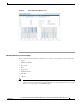
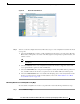
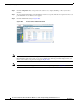
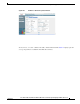
Figure 96 Link Test Results
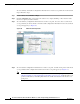
Step 5 To view a graphical representation of SNR statistics over a period of time, click the arrow on the link. A
window with multiple SNR graphs appears (see Figure 97).
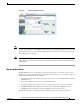
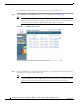
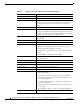
The following graphs are displayed for the link:
• SNR Up—Plots the RSSI values of the neighbor from the perspective of the mesh access point.
• SNR Down—Plots the RSSI values that the neighbor reports to the mesh access point.
• Link SNR—Plots a weighed and filtered measurement based on the SNR Up value.
• The Adjusted Link Metric —Plots the value used to determine the least cost path to the root mesh access
point. This value is the ease to get to the rooftop access point and accounts for the number of hops. The
lower the ease value, the less likely the path is used.
• The Unadjusted Link Metric —Plots the least cost path to get to the root access point unadjusted by the
number of hops. The higher the value for the unadjusted link, the better the path.