
Troubleshooting Guide


Debugging Logs
March 2012 31
Debugging Thresholds
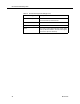
When setting the debugging threshold, keep in mind that the more detail the
threshold provides, the slower the performance of your PC and increases the size of
the debug file. Table 12 lists the debugging thresholds that are available for all
services except Desktop Monitoring Console.
Enabling Debugging for Java Applications
To enable debugging for Java applications:
1. Navigate to the appropriate folder.
■
For CAD-BE, navigate to the folder specified in Table 11 on page 30.
■
For all other Java applications, on the server on which the CAD services
are installed, navigate to C:\Program Files\Cisco\Desktop\tomcat\conf.
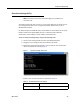
2. Open the properties file. The configuration file contains one or more of the
following debugging statements at the beginning of the file.
Linux Mozilla Firefox Save the properties file to your home directory.
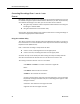
Table 12. Debugging Thresholds
Threshold Events Recorded
Debug • Minor and frequently-occurring normal events. This level is usually
sufficient for debugging a problem, and will not affect the
computer’s performance.
Call • Minor and frequently-occurring normal events
• Entering and exiting functions
Trace • Minor and frequently-occurring normal events
• Entering and exiting functions
• Detail debugging (for instance, loops)
Dump • Minor and frequently-occurring normal events
• Entering and exiting functions
• Detail debugging (for instance, loops)
•Byte dumps
Off Turns off debugging. This is the default setting.
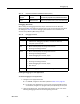
Table 11. Properties file location and additional actions(cont’d)
Operating
System Browser Location of properties file/additional actions