
Troubleshooting guide

11-52
ATM and Layer 3 Switch Router Troubleshooting Guide
OL-1969-01
Chapter 11 Troubleshooting Layer 3 Network Connections
Troubleshooting Route Processor Route Table and Utilization Problems
Troubleshooting Route Processor Route Table Problems Commands
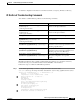
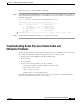
To display the route processor route table statistics, use the following commands:
Troubleshooting Route Processor Route Table Problems
This section describes common symptoms and causes of, and solutions to, high route processor
utilization on your switch router.
For additional information about high route processor utilization, refer to the
Troubleshooting High CPU Utilization on Cisco Routers web page at the URL:
http://www.cisco.com/warp/public/63/highcpu.html
.
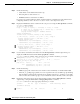
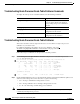
Follow these steps to troubleshoot route processor route table problems:
Step 1 Use the show processes cpu command to check the route processor route table and processes.
Switch# show processes cpu
CPU utilization for five seconds: 99%/24%; one minute: 25%; five minutes: 8%
PID Runtime(ms) Invoked uSecs 5Sec 1Min 5Min TTY Process
1 8 2750 2 0.00% 0.00% 0.00% 0 Load Meter
2 69168 14972355 4 0.00% 2.38% 0.88% 0 Exec
3 13940 1771 7871 0.00% 0.10% 0.11% 0 Check heaps
4 536 541 990 0.00% 0.00% 0.00% 0 Pool Manager
5 0 2 0 0.00% 0.00% 0.00% 0 Timers
6 36 301 119 0.00% 0.00% 0.00% 0 ARP Input
.
(Information Deleted)
.
63 196252 40503 4845 66.72% 25.93% 6.25% 0 IP-EIGRP Router
Step 2 Check the CPU utilization for five seconds field. In this example, it indicates the CPU has spiked to 99%
with 24% at the interrupt level, where 99%/24% is equal to the following:
• 99%—Average total utilization during last five seconds
• 24%—Average utilization due to interrupts, during last five seconds
• 99 – 24 = 75—Percentage of traffic being process-switched
Note If the CPU utilization in the example indicated 99%/24%, that means the route processor is being
consumed by interrupt-driven processes.
Command Purpose
show processes cpu Displays information about the active
processes in the switch router and their
corresponding route processor utilization
statistics.
show {ip | ipx} traffic Displays IP and IPX traffic statistics.
show ip spd Displays selective packet discard
configuration for the switch.
show epc spd Displays selective packet discard
configuration for the interfaces.