
user manual


Table Of Contents
- User Guide for Internetwork Performance Monitor
- Contents
- Preface
- Overview of IPM
- Getting Started With IPM
- Using IPM to Measure Network Performance
- Measuring Network Performance for DHCP
- Measuring Network Performance for DLSw
- Measuring Network Performance for DNS
- Measuring Network Performance for HTTP
- Measuring Network Performance for FTP
- Measuring Network Performance for IP
- Measuring Network Performance for SNA
- Measuring Network Performance for TCP
- Measuring Network Performance for UDP
- Measuring Network Performance for Enhanced UDP
- Modifying IPM Components
- Working With Source Devices
- Working With Target Devices
- Working With Operations
- Working With Collectors
- Adding Components Using Seed Files
- Changing IP Addresses
- Setting the Baseline
- Setting IPM Database Preferences
- Setting SNMP Timeout and Retry Environment Variables
- Setting New IPM Server Process Timeout Values
- Setting the DISPLAY Variable in Solaris
- Backing Up or Restoring the IPM Database
- NVRAM Settings
- Managed Source Interface Settings
- Changing Administrative Password
- Changing IPM Database Password
- Working With Message Log Window
- Working With IPM From the CiscoWorks Homepage
- Accessing IPM Data From the CiscoWorks Homepage
- Viewing IPM Server Information
- Importing Devices From Device and Credential Repository
- Downloading the IPM Client
- Viewing Configuration Information
- Viewing Latency Data
- Viewing Jitter Data
- Viewing HTTP Data
- Accessing Software Updates and Additional Information
- IPM FAQs and Troubleshooting Tips
- IPM Command Reference
- SA Agent Feature Mapping
- Glossary
- Index
2-20
User Guide for Internetwork Performance Monitor
OL-11291-01
Chapter 2 Getting Started With IPM
Viewing Network Performance Statistics
Viewing Historical Network Performance Statistics
To view statistics gathered over an historical monitoring period:
Step 1 From the IPM Main Window (Figure 2-2), select one or more collectors (up to 10) to be viewed.
Step 2 Select View > Statistics.
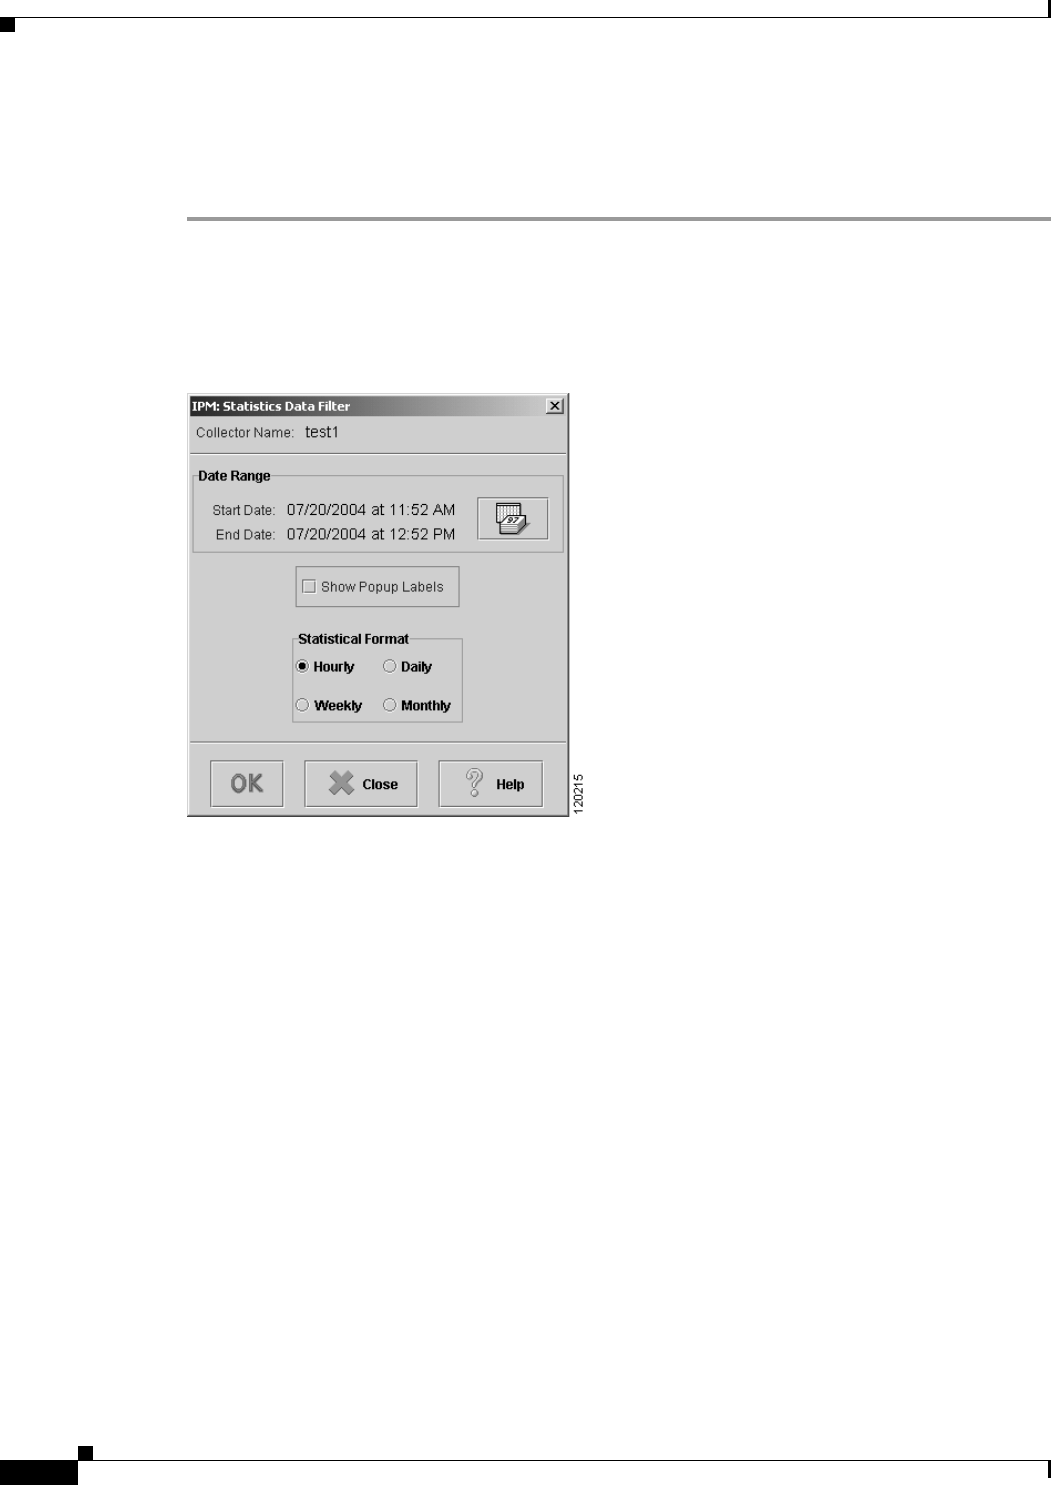
The Statistics Data Filter window (Figure 2-10) appears.
Figure 2-10 Statistics Data Filter Window
Step 3
In this window, specify the time period for which you want to view statistics.
You can view statistics for all or part of the time that the data was collected. The window displays the
currently defined start date and end date.
Step 4 To change the date range, click the Calendar icon.
The Set Date Range window appears (Figure 2-6).
Step 5 Specify a new start date, a new end date, or both, and click OK.
The start time and end time you specified for the collector for viewing statistics appears.
For more information about changing the date range, see the Defining a Collector.
To make graphs easier to read, IPM provides optional popup labels for historical graphs. (Popup labels
are always on for real-time graphs.)
When you turn on popup labels for a graph, you can roll the cursor over a collection point on the graph
and see a popup label containing key information for that point, such as the exact latency value.
To turn on popup labels for a graph, select the Show Popup Labels checkbox. To turn off popup labels,
clear the checkbox.