
user manual


Table Of Contents
- User Guide for Internetwork Performance Monitor
- Contents
- Preface
- Overview of IPM
- Getting Started With IPM
- Using IPM to Measure Network Performance
- Measuring Network Performance for DHCP
- Measuring Network Performance for DLSw
- Measuring Network Performance for DNS
- Measuring Network Performance for HTTP
- Measuring Network Performance for FTP
- Measuring Network Performance for IP
- Measuring Network Performance for SNA
- Measuring Network Performance for TCP
- Measuring Network Performance for UDP
- Measuring Network Performance for Enhanced UDP
- Modifying IPM Components
- Working With Source Devices
- Working With Target Devices
- Working With Operations
- Working With Collectors
- Adding Components Using Seed Files
- Changing IP Addresses
- Setting the Baseline
- Setting IPM Database Preferences
- Setting SNMP Timeout and Retry Environment Variables
- Setting New IPM Server Process Timeout Values
- Setting the DISPLAY Variable in Solaris
- Backing Up or Restoring the IPM Database
- NVRAM Settings
- Managed Source Interface Settings
- Changing Administrative Password
- Changing IPM Database Password
- Working With Message Log Window
- Working With IPM From the CiscoWorks Homepage
- Accessing IPM Data From the CiscoWorks Homepage
- Viewing IPM Server Information
- Importing Devices From Device and Credential Repository
- Downloading the IPM Client
- Viewing Configuration Information
- Viewing Latency Data
- Viewing Jitter Data
- Viewing HTTP Data
- Accessing Software Updates and Additional Information
- IPM FAQs and Troubleshooting Tips
- IPM Command Reference
- SA Agent Feature Mapping
- Glossary
- Index
2-19
User Guide for Internetwork Performance Monitor
OL-11291-01
Chapter 2 Getting Started With IPM
Viewing Network Performance Statistics
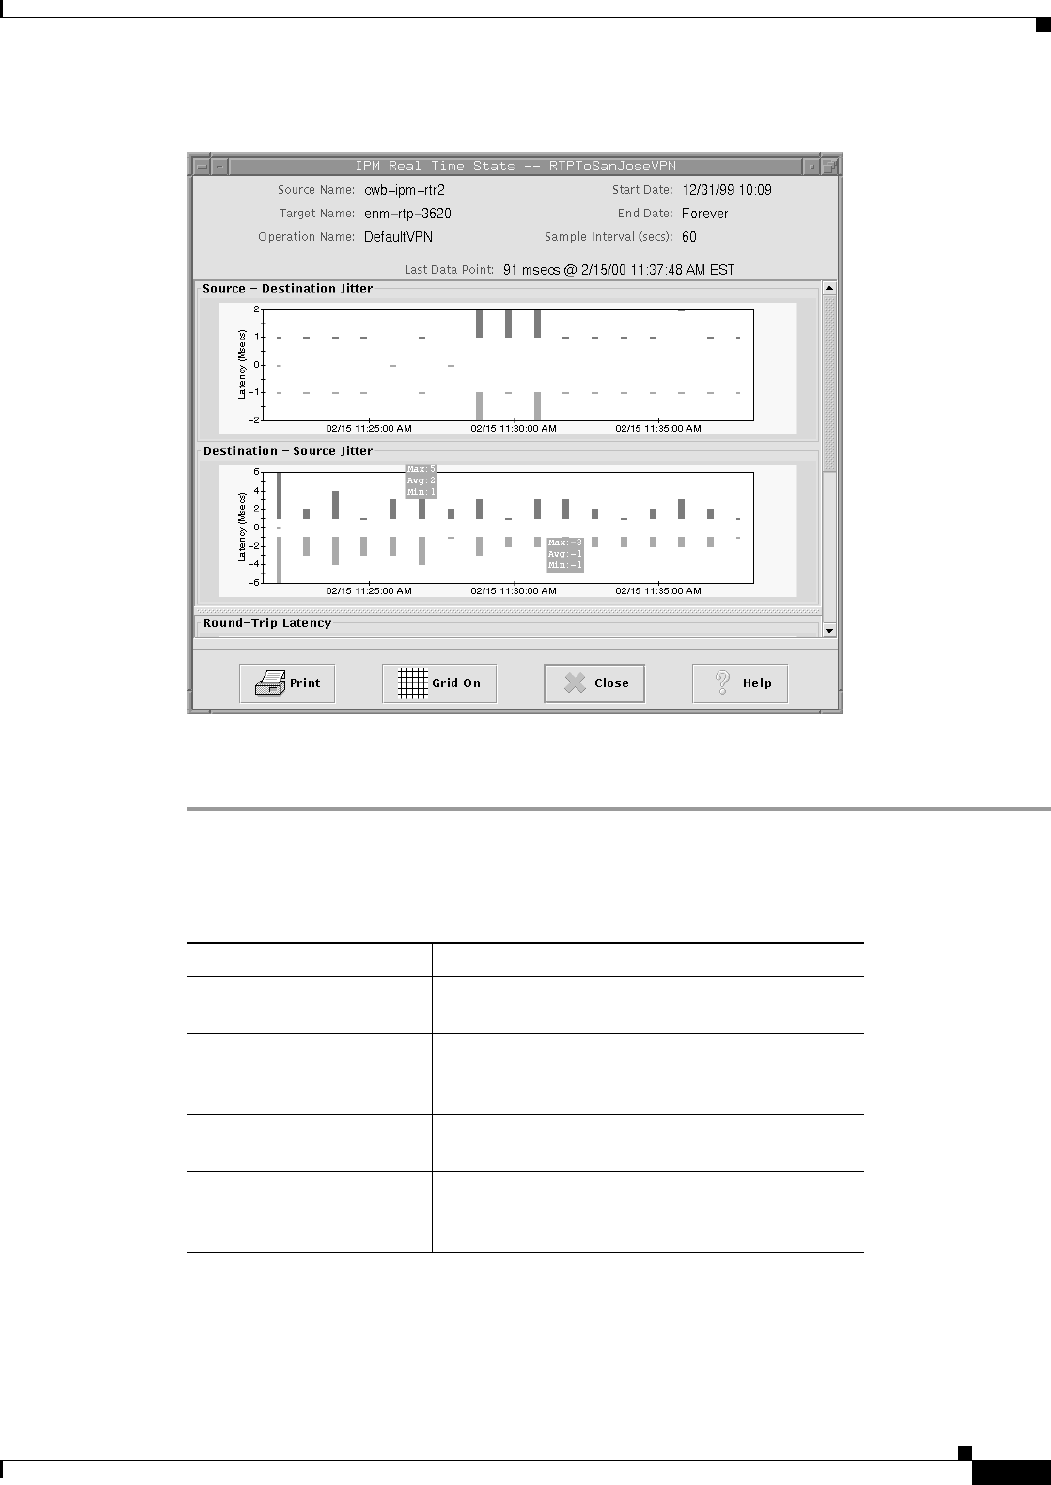
Figure 2-9 Jitter Real Time Statistics Window
Statistics appear as soon as the frequency interval elapses. Data points are added to the graph for each
interval that the statistics are measured for the selected collector.
Table 2-2 describes the actions you can perform in the Real Time Statistics window.
39288
Table 2-2 Real Time Statistics Window Options
Action Key Combination
Zoom in on a specific point
on the graph.
Press Shift and click a point on the graph.
Zoom in on a specific area
of the graph.
Press Shift and drag and click on an area of the
graph. Release the mouse button and the graph
zooms in on the area you selected.
Zoom out to the graph’s
original view.
Click anywhere on the graph.
Shift the x-axis or y-axis of
the graph through the data.
Press Ctrl and click a point on the graph, then drag
left or right to go backward or forward, or drag up
or down to shift the x-axis of the graph.