
user manual


Table Of Contents
- User Guide for Internetwork Performance Monitor
- Contents
- Preface
- Overview of IPM
- Getting Started With IPM
- Using IPM to Measure Network Performance
- Measuring Network Performance for DHCP
- Measuring Network Performance for DLSw
- Measuring Network Performance for DNS
- Measuring Network Performance for HTTP
- Measuring Network Performance for FTP
- Measuring Network Performance for IP
- Measuring Network Performance for SNA
- Measuring Network Performance for TCP
- Measuring Network Performance for UDP
- Measuring Network Performance for Enhanced UDP
- Modifying IPM Components
- Working With Source Devices
- Working With Target Devices
- Working With Operations
- Working With Collectors
- Adding Components Using Seed Files
- Changing IP Addresses
- Setting the Baseline
- Setting IPM Database Preferences
- Setting SNMP Timeout and Retry Environment Variables
- Setting New IPM Server Process Timeout Values
- Setting the DISPLAY Variable in Solaris
- Backing Up or Restoring the IPM Database
- NVRAM Settings
- Managed Source Interface Settings
- Changing Administrative Password
- Changing IPM Database Password
- Working With Message Log Window
- Working With IPM From the CiscoWorks Homepage
- Accessing IPM Data From the CiscoWorks Homepage
- Viewing IPM Server Information
- Importing Devices From Device and Credential Repository
- Downloading the IPM Client
- Viewing Configuration Information
- Viewing Latency Data
- Viewing Jitter Data
- Viewing HTTP Data
- Accessing Software Updates and Additional Information
- IPM FAQs and Troubleshooting Tips
- IPM Command Reference
- SA Agent Feature Mapping
- Glossary
- Index
2-13
User Guide for Internetwork Performance Monitor
OL-11291-01
Chapter 2 Getting Started With IPM
Configuring the IPM Components
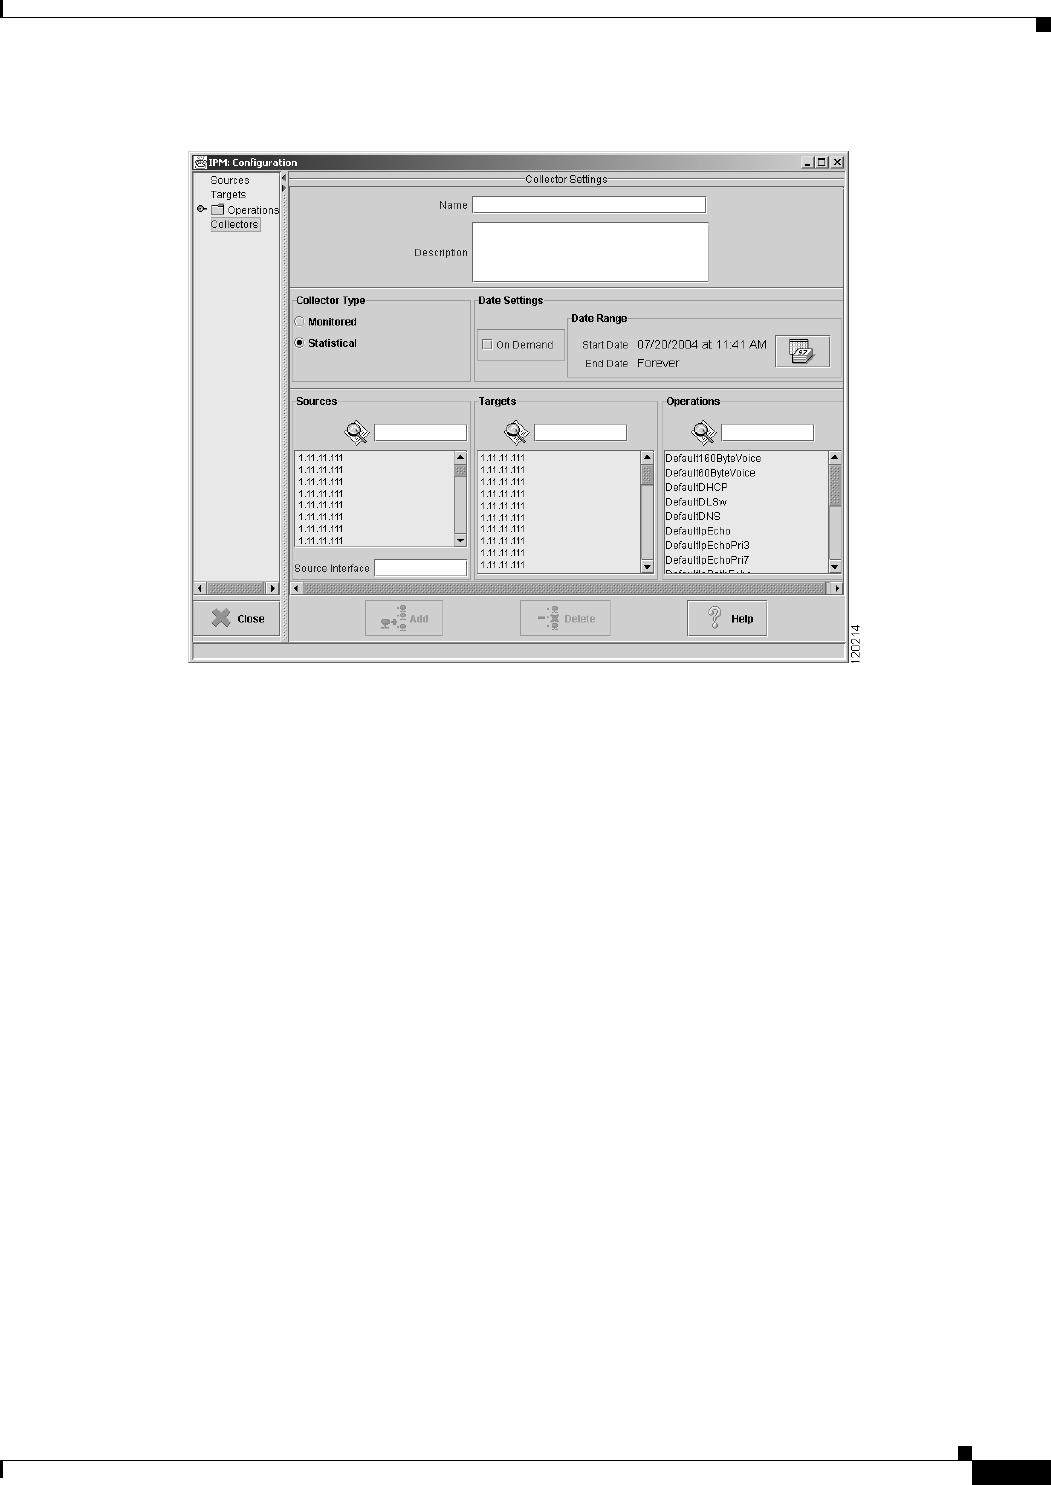
Figure 2-5 Collector Configuration Window
Step 3
In the Name field, type a name to assign to the collector. In the Description field, you can enter a brief
description of the collector.
Though the Name field in the Collector Settings dialog box allows you to enter more than 15 characters,
the trap PDUs displays only the first 15 characters. The IPM database, however, will contain the
complete collector name you have entered.
Step 4 In the Collector Type field:
• Select Statistical to gather data and store it in the IPM database for future analysis. This is the
default setting.
• Select Monitored to monitor for threshold violations and view data in real-time, but network
performance data is not stored in the IPM database.
Step 5 Do one of the following tasks to define the schedule for the collector:
• To configure and start the collector at a later time, enable the On Demand option and go to Step 10.
• To specify when the collector starts, click Set Date. The Set Date Range window is displayed
(Figure 2-6). By default, the collector schedule is set to start now and run forever.