
user manual


Table Of Contents
- User Guide for Internetwork Performance Monitor
- Contents
- Preface
- Overview of IPM
- Getting Started With IPM
- Using IPM to Measure Network Performance
- Measuring Network Performance for DHCP
- Measuring Network Performance for DLSw
- Measuring Network Performance for DNS
- Measuring Network Performance for HTTP
- Measuring Network Performance for FTP
- Measuring Network Performance for IP
- Measuring Network Performance for SNA
- Measuring Network Performance for TCP
- Measuring Network Performance for UDP
- Measuring Network Performance for Enhanced UDP
- Modifying IPM Components
- Working With Source Devices
- Working With Target Devices
- Working With Operations
- Working With Collectors
- Adding Components Using Seed Files
- Changing IP Addresses
- Setting the Baseline
- Setting IPM Database Preferences
- Setting SNMP Timeout and Retry Environment Variables
- Setting New IPM Server Process Timeout Values
- Setting the DISPLAY Variable in Solaris
- Backing Up or Restoring the IPM Database
- NVRAM Settings
- Managed Source Interface Settings
- Changing Administrative Password
- Changing IPM Database Password
- Working With Message Log Window
- Working With IPM From the CiscoWorks Homepage
- Accessing IPM Data From the CiscoWorks Homepage
- Viewing IPM Server Information
- Importing Devices From Device and Credential Repository
- Downloading the IPM Client
- Viewing Configuration Information
- Viewing Latency Data
- Viewing Jitter Data
- Viewing HTTP Data
- Accessing Software Updates and Additional Information
- IPM FAQs and Troubleshooting Tips
- IPM Command Reference
- SA Agent Feature Mapping
- Glossary
- Index
5-22
User Guide for Internetwork Performance Monitor
OL-11291-01
Chapter 5 Working With IPM From the CiscoWorks Homepage
Viewing Latency Data
In all IPM Web reports, if the Error % field shows 100%, then the Avg (average) and Avg Max (average
maximum) fields show N/A (not available), because no data is available.
For Weekly Reports, the start time is always the beginning of the Week i.e. Sunday.
Consider a Collector started on 16 January 2002, which is Wednesday. The Weekly Data for that
Collector would have a time stamp of 13 January 2002, which is Sunday (the start date of that week).
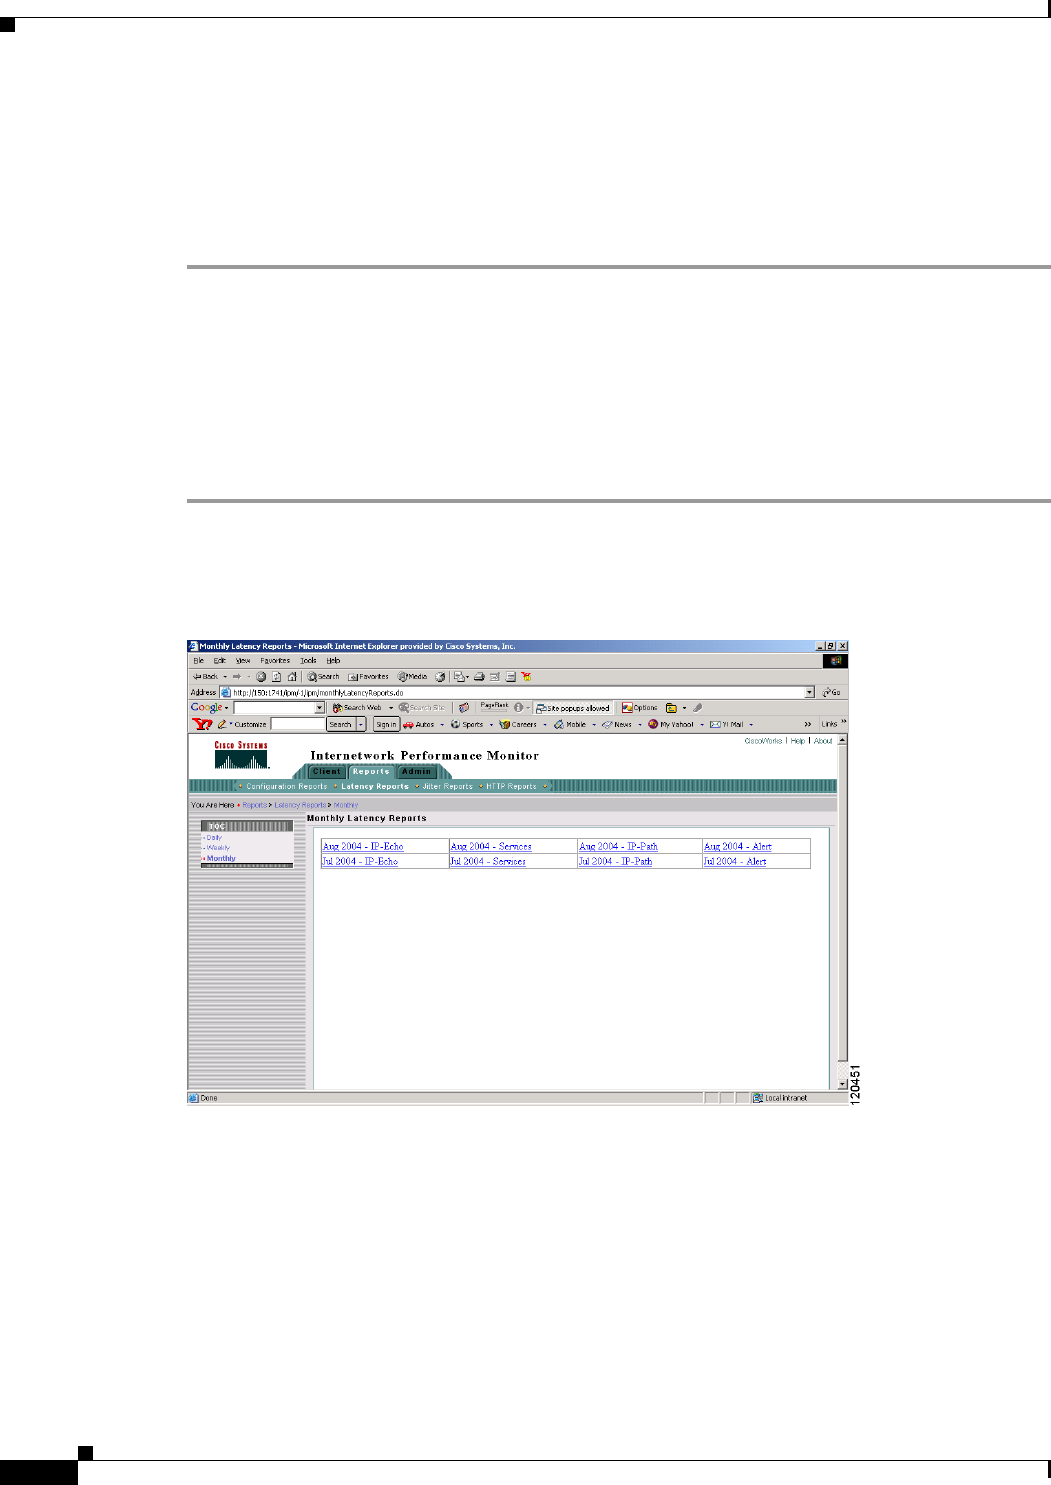
Viewing Monthly Latency Data
From the CiscoWorks homepage, you can view a monthly summary of latency data for each collector on
the IPM server.
To view monthly latency data collected by IPM:
Step 1 Select Internetwork Performance Monitor > Reports > Latency Reports > Monthly.
The Monthly Latency Reports page (Figure 5-21) appears.
Figure 5-21 Monthly Latency Reports Page
Step 2
To view more detailed information from the Weekly Latency Reports page, select a report for a specific
date, then select one of the following options for the month you want to view:
• IP-Echo—To view monthly latency statistics for all IP Echo collectors. The Monthly IP-Echo
Latency Summary Report page appears.
• Services—To view monthly latency statistics for all other non-IP collectors and IP-based services.
The Monthly Services Latency Summary Report page appears.
• IP-Path—To view monthly latency statistics for all IP Path Echo collectors. The Monthly IP-Path
Latency Summary Report page appears.
If a path never reaches its target, IPM calculates the Web report based on the last hop in each path.